Web Interface Operation
1. System Overview
The system is mainly used for local debugging of C&I Energy Manager, including data display, warning and fault alarm, configuration modification and instruction issuance, configuration strategy, and historical data viewing and export.
- This product is displayed and interacted in web form and supports Windows, Linux, and Android (including mobile phones and tablets).
- The standard resolution is 1366*768, and you can freely zoom in/out the browser, or you can freely adjust it by zooming in/out in the browser.
The system does not support UC Browser, and it is recommended to use Google Chrome.
- Please do not use a resolution lower than the standard resolution, otherwise, the content may not be displayed properly.
- Please do not use devices with too small a screen size, as this may result in incomplete display of some content.
2. Login Steps
2.1 Network Links
The product uses LAN network communication and supports WiFi or network port connection:
- Wi-Fi connection: Select the device's default SSID (IGEN_WIFI) from the Wi-Fi list on your computer and enter the password (12345678).
- For network port connection, simply plug into the gateway's LAN port.

2.2 Log in to the web interface
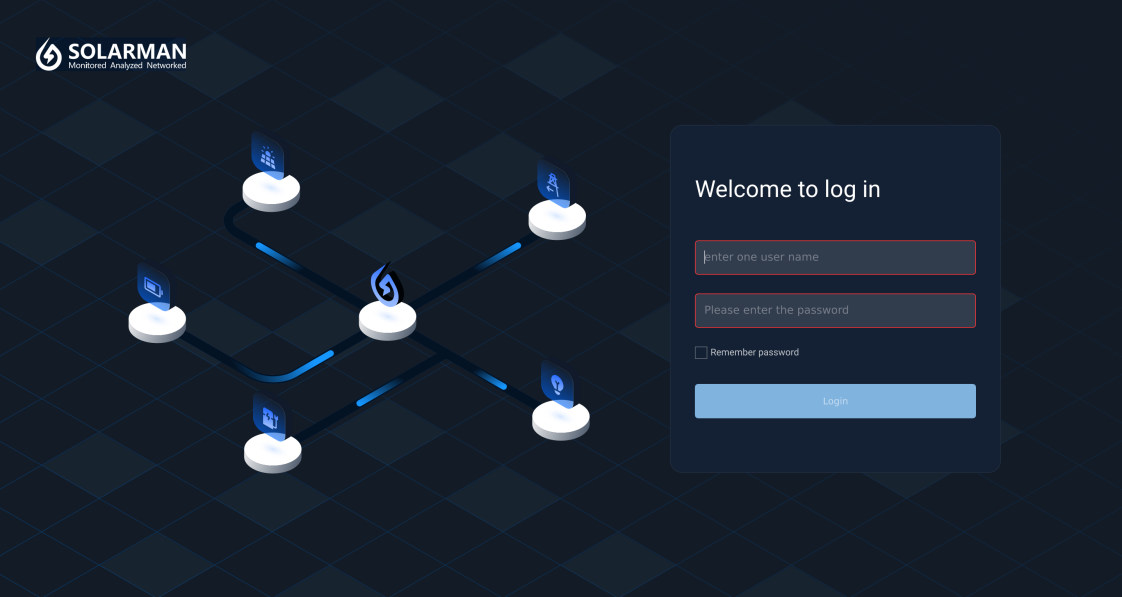
Make sure the network and network port are connected properly, open the browser and enter the following address to access the Web host computer:
- Wi-Fi connection login address: https://192.168.123.10:33333/index.html
- LAN port login address: https://172.19.130.109:33333/index.html
When connecting to the device through a network port, you need to set the computer's IP address to the same IP network segment as the device's corresponding network port in order to access the Web management interface.
2.3 Account and Password
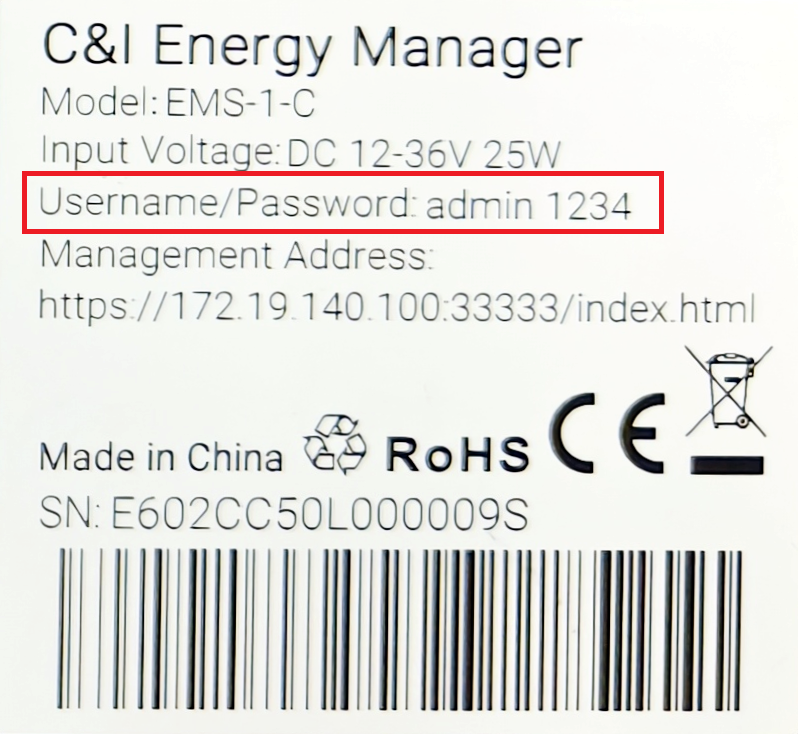
The product adopts the "one machine, one password" format. Each product has its own independent password and cannot be used interchangeably. The account number and initial login password are printed on the shell label, as shown below:
- Account: admin
- Password: 1234
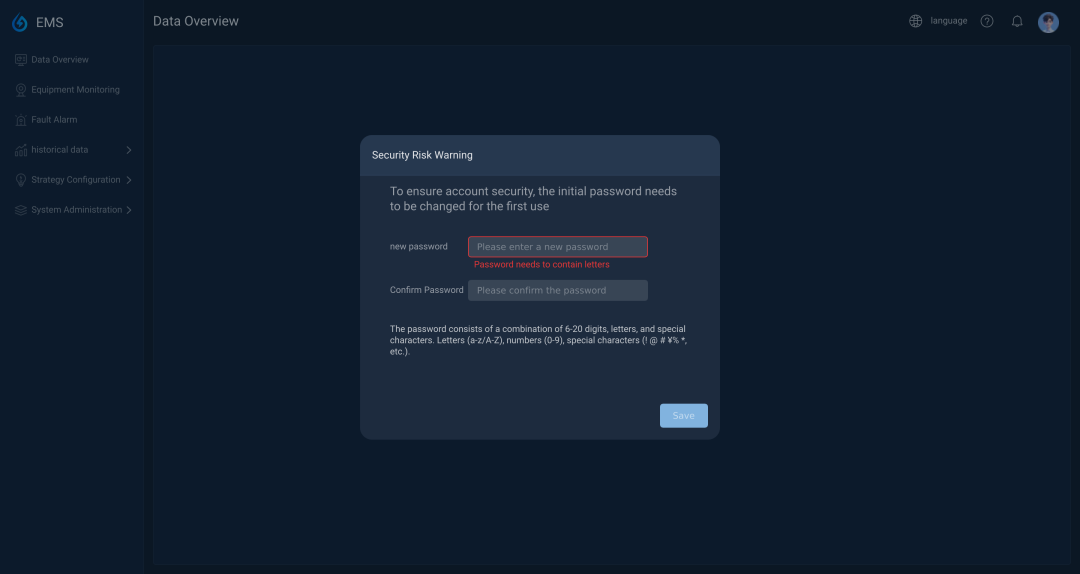
Please use the default initial login password for the first time login. After logging in, the Web interface will force you to change your password, as shown below.
Currently, the product has only one login account and multiple accounts cannot be added. Please keep your password safe after changing it.
3. Top status bar
3.1 Language Switching
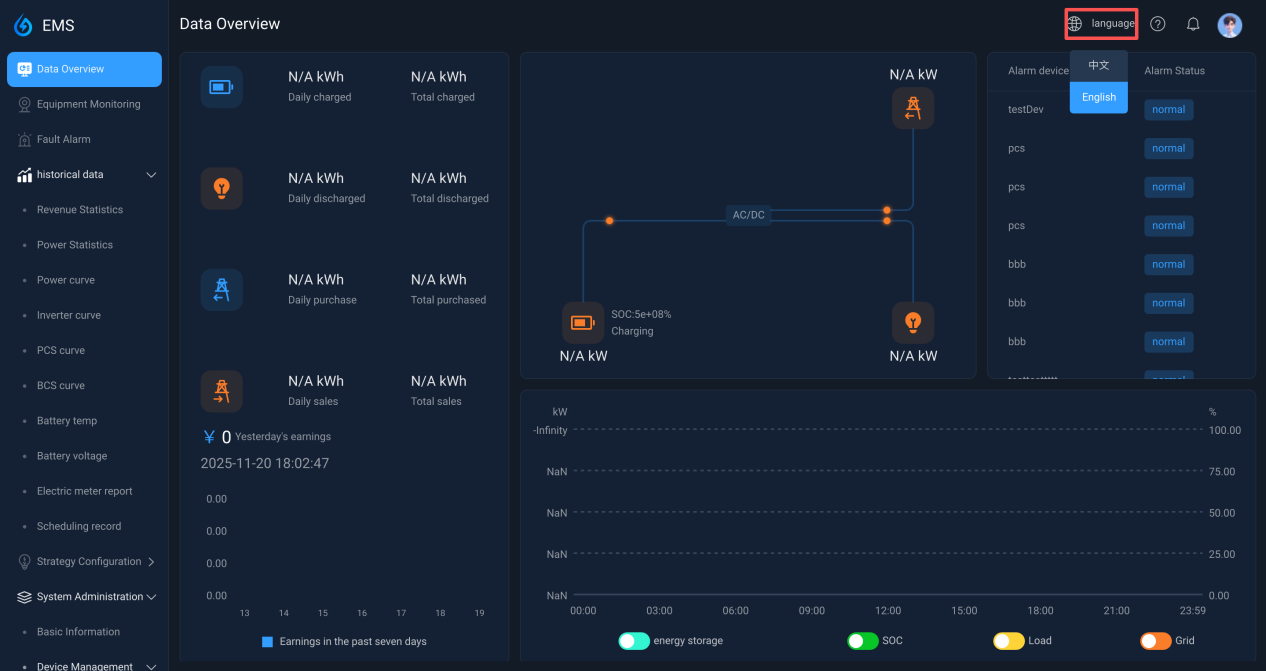
The Web host computer currently supports switching between Chinese and English. Click the  language option and select the required language from the drop-down list.
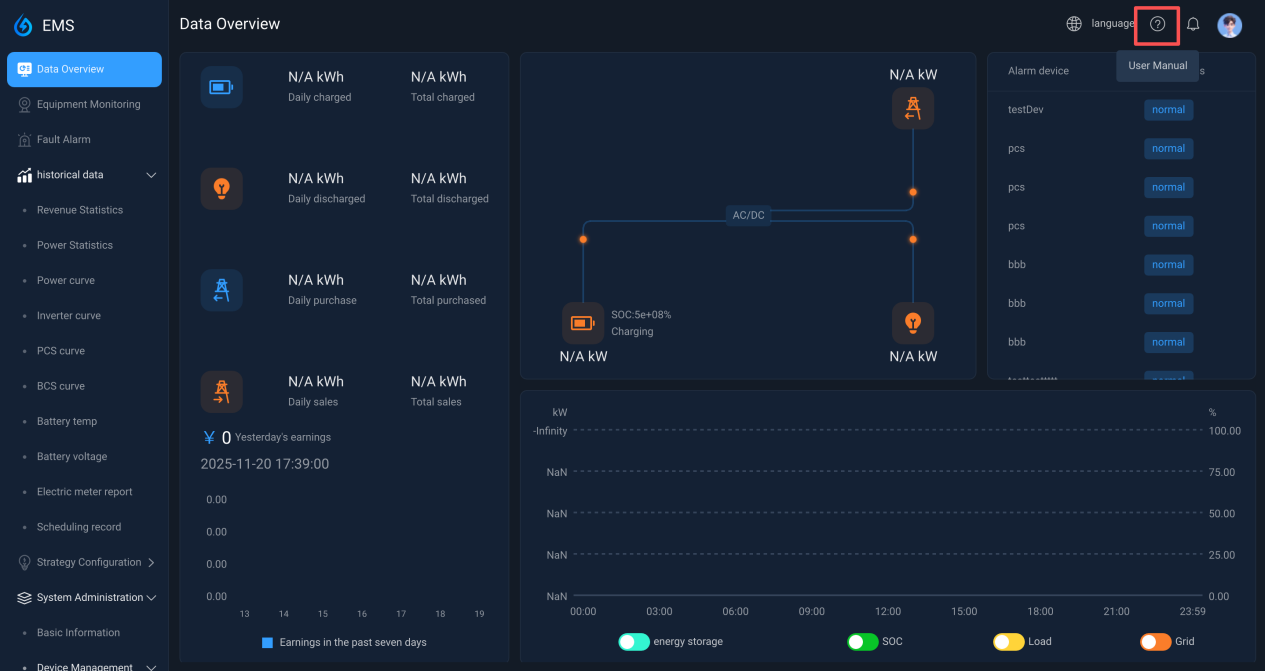
3.2 Help
Click the  icon to download the user manual.
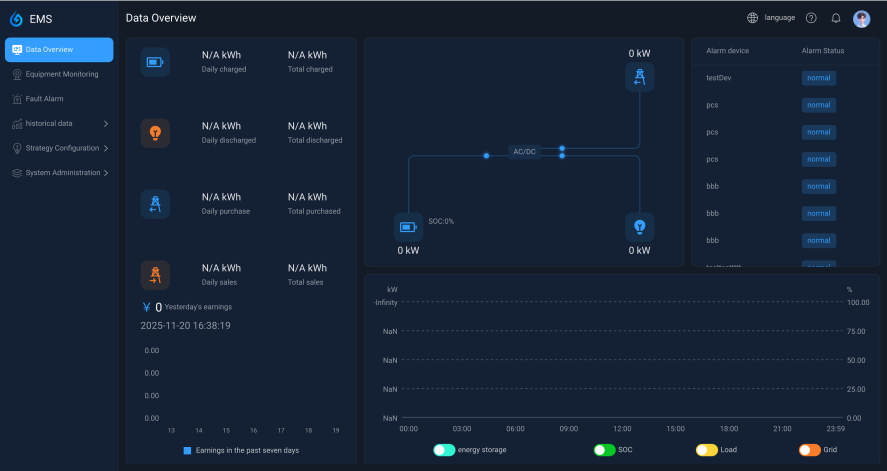
3.3 Message Notification
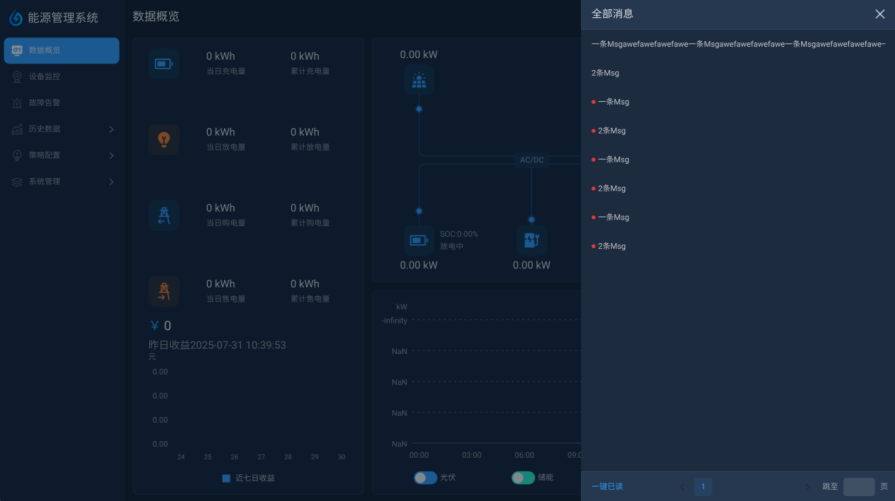
Click the  icon to view read and unread messages.
Click View All to open more historical messages, and one-click reading operation is also supported.
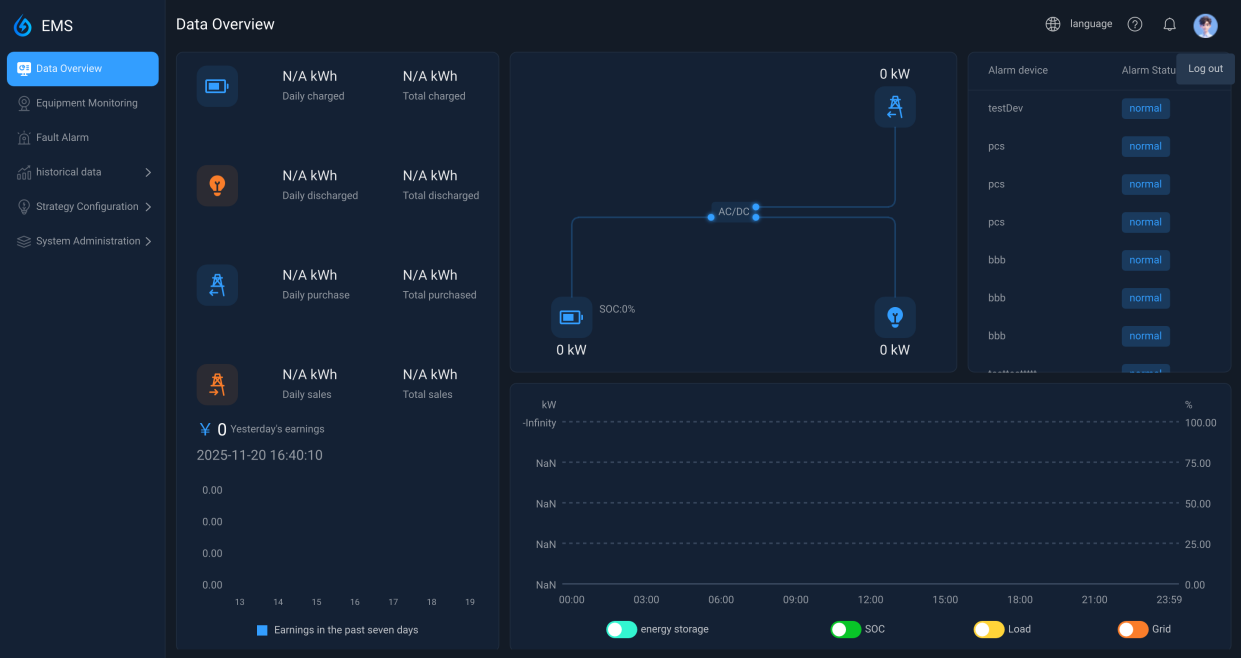
3.4 Logout
Click Log out to return to the login interface.
4. Data Overview
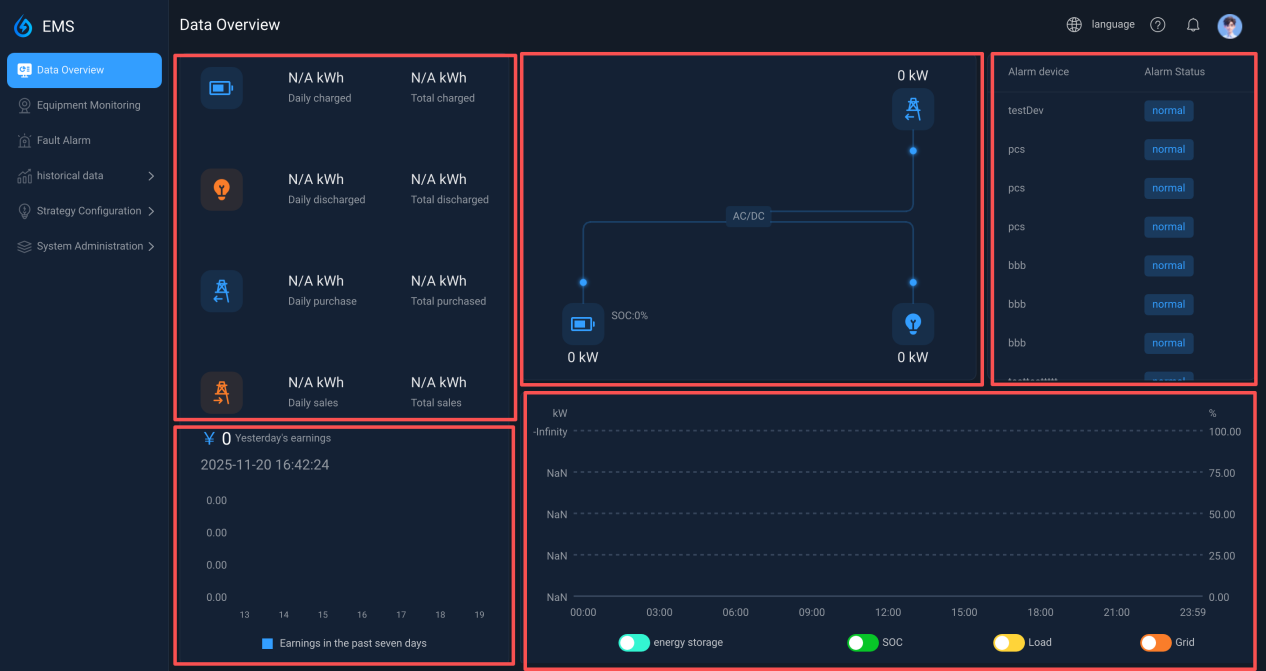
The overview interface contains five data panels, and the displayed content will change dynamically depending on whether the system is configured with charging piles/photovoltaic.
① Mainly display the data of the day and the cumulative data
② Mainly displays the earnings of the past 7 days
③ Current power flow
④ Current alarm information
⑤ The power curve of the day. Click the switch button below to temporarily display or hide the curve.
5. Equipment Monitoring
5.1 PCS
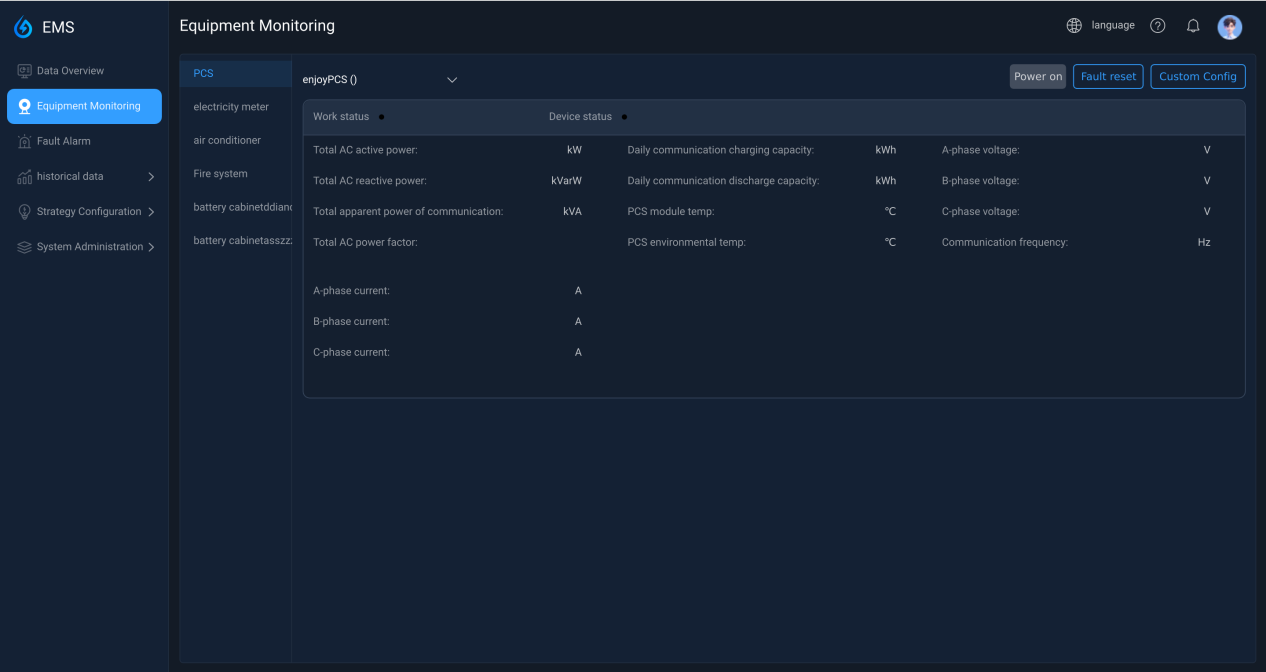
This interface displays the data and status of the PCS. You can click the Customize button in the upper right corner to execute commands and configurations.
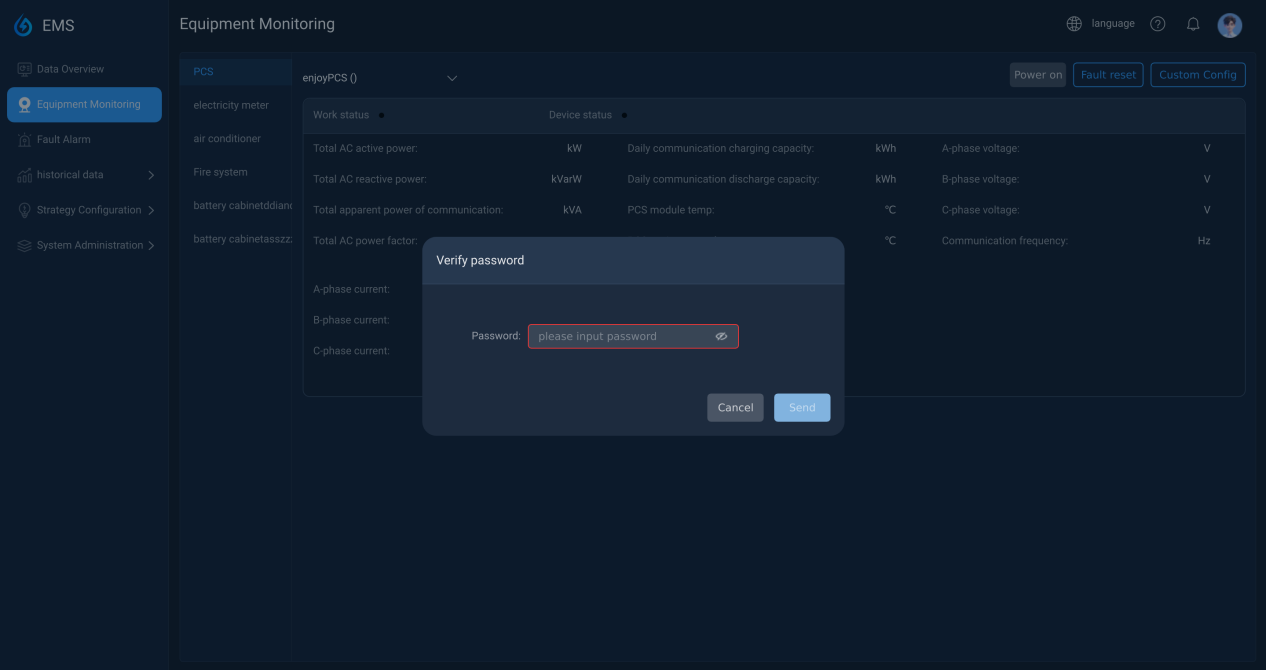
The password 1234 is required for execution.
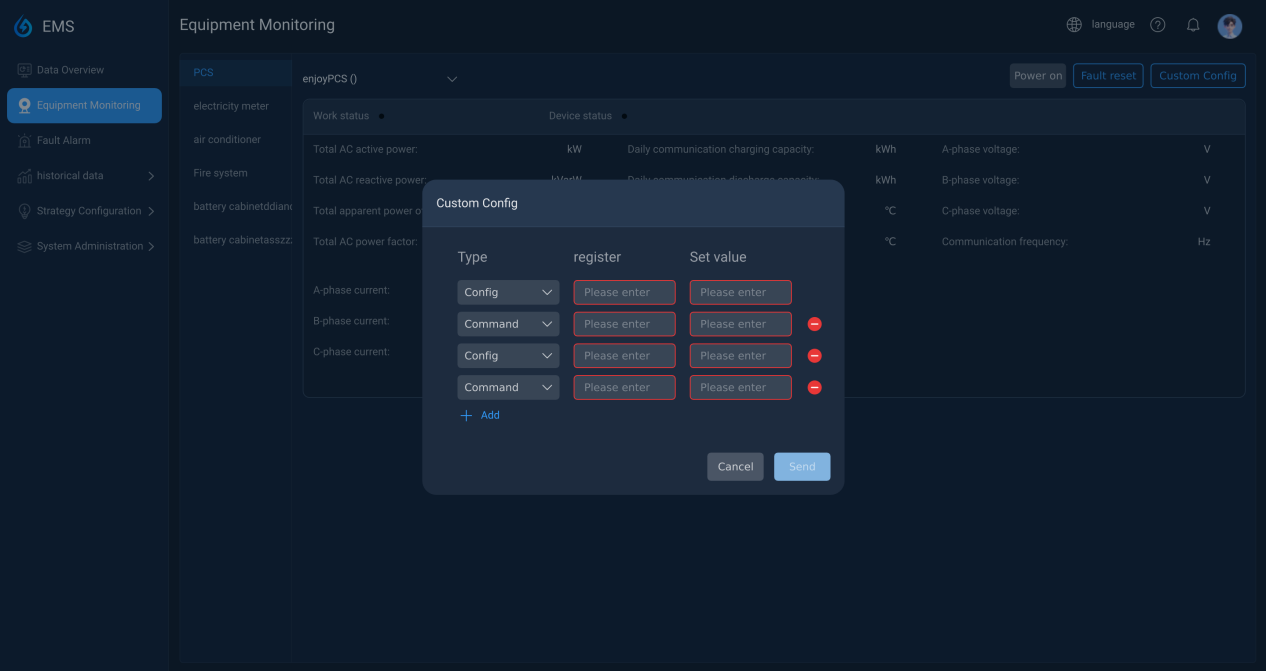
Under certain conditions, you can use custom configuration instructions to issue specific instructions. The specific interface is as follows. If you need to perform special operations, please contact our technical support.
5.2 BMS
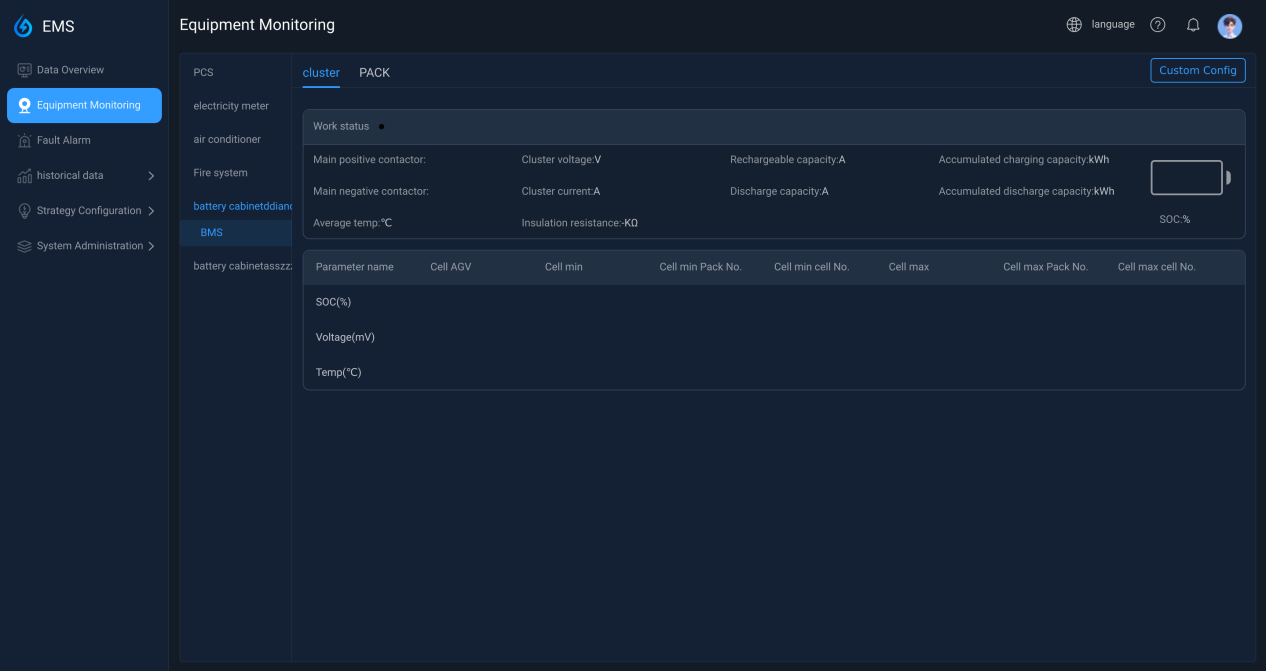
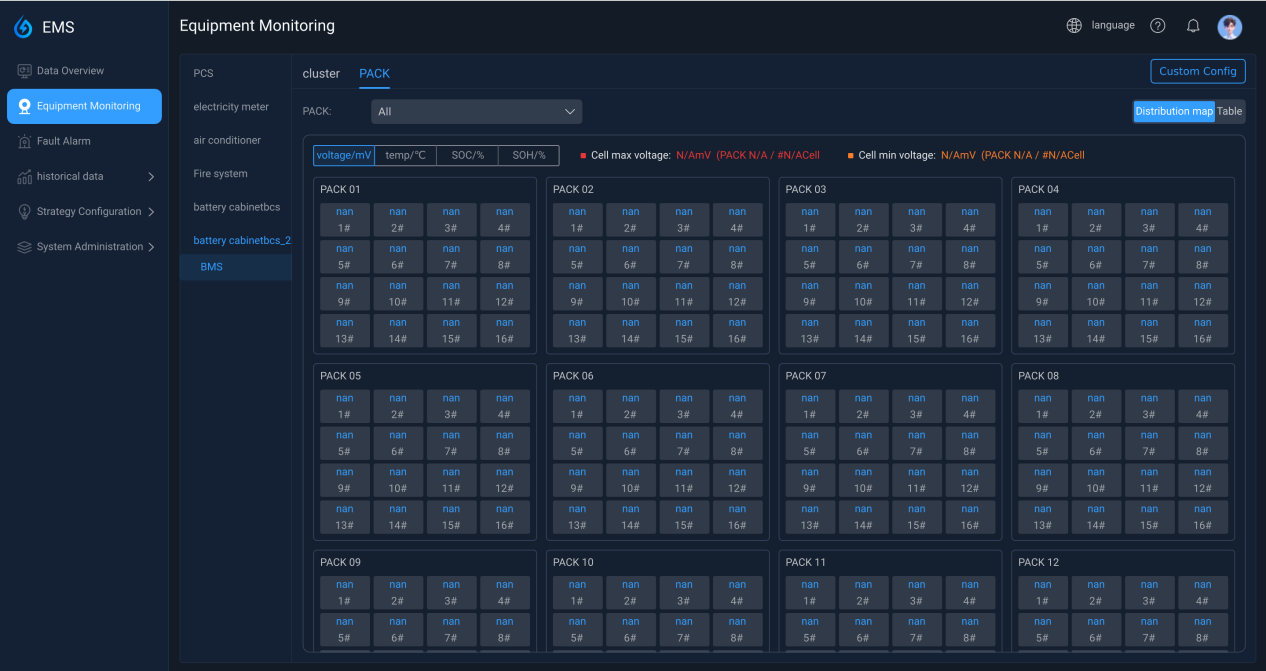
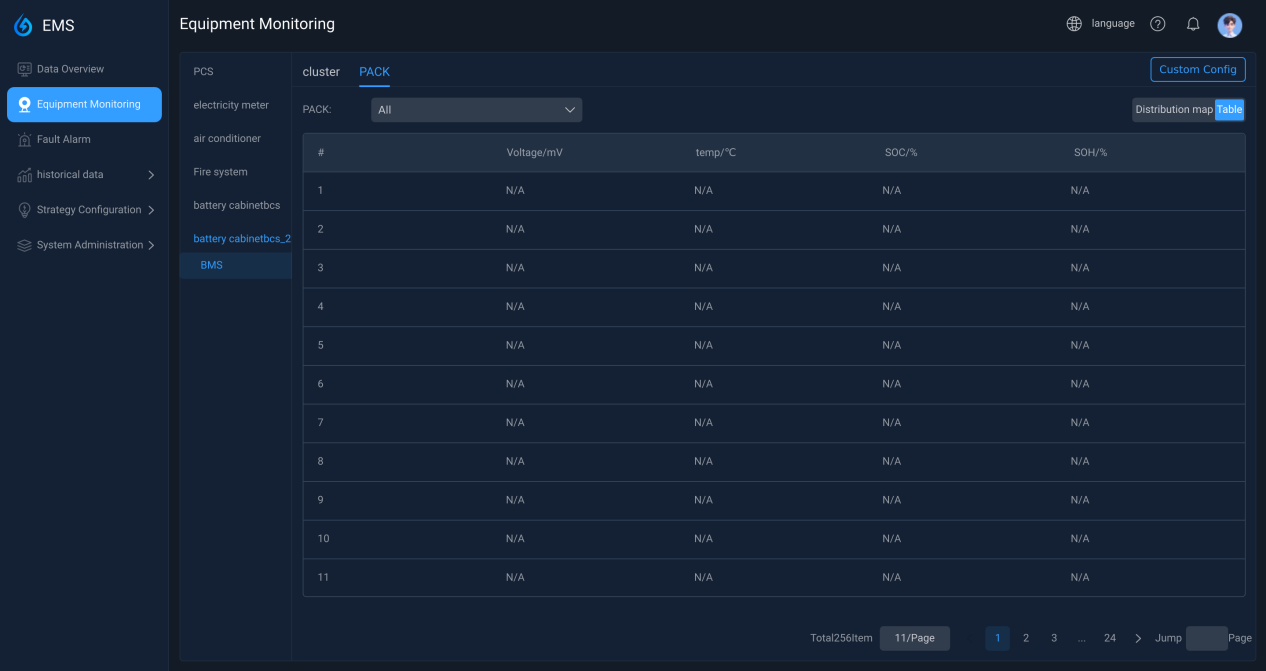
This screen displays BMS data. Switch the tabs at the top to view the BMS overview, cluster-level data, and cell data.
-
Cluster-level data
-
Individual data (distribution chart view)
-
Single data (table view)
5.3 Electricity Meter
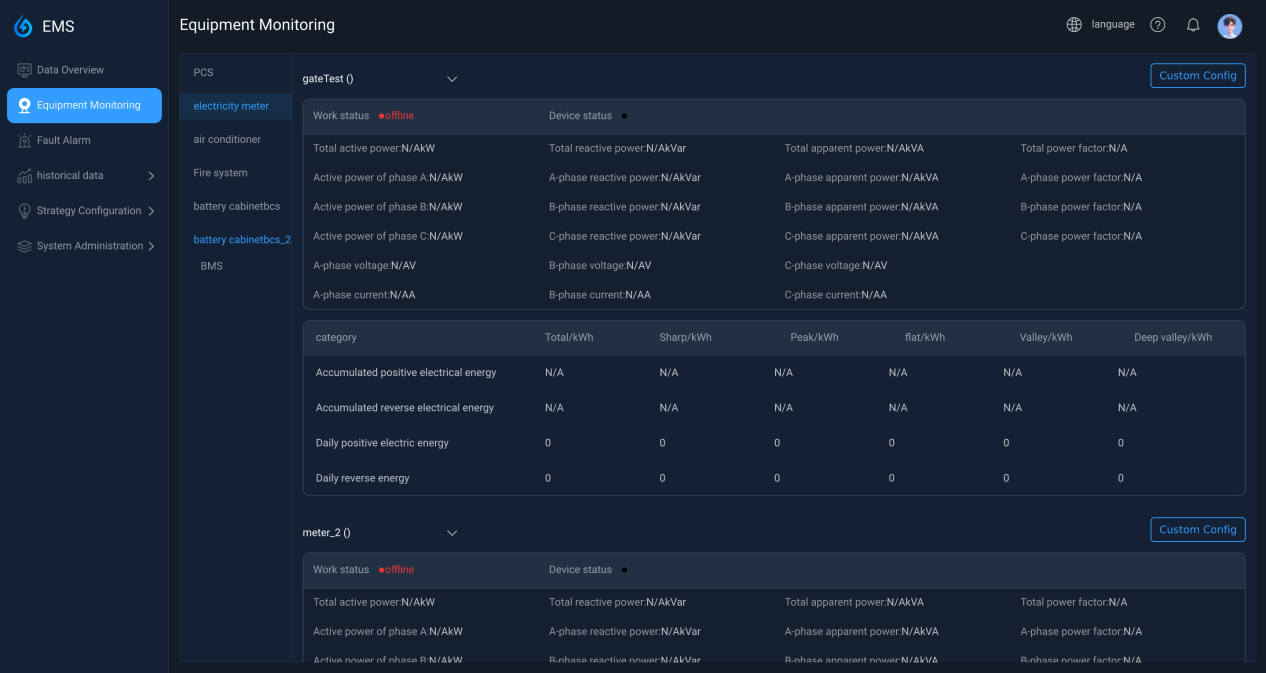
This interface displays the electricity meter data.
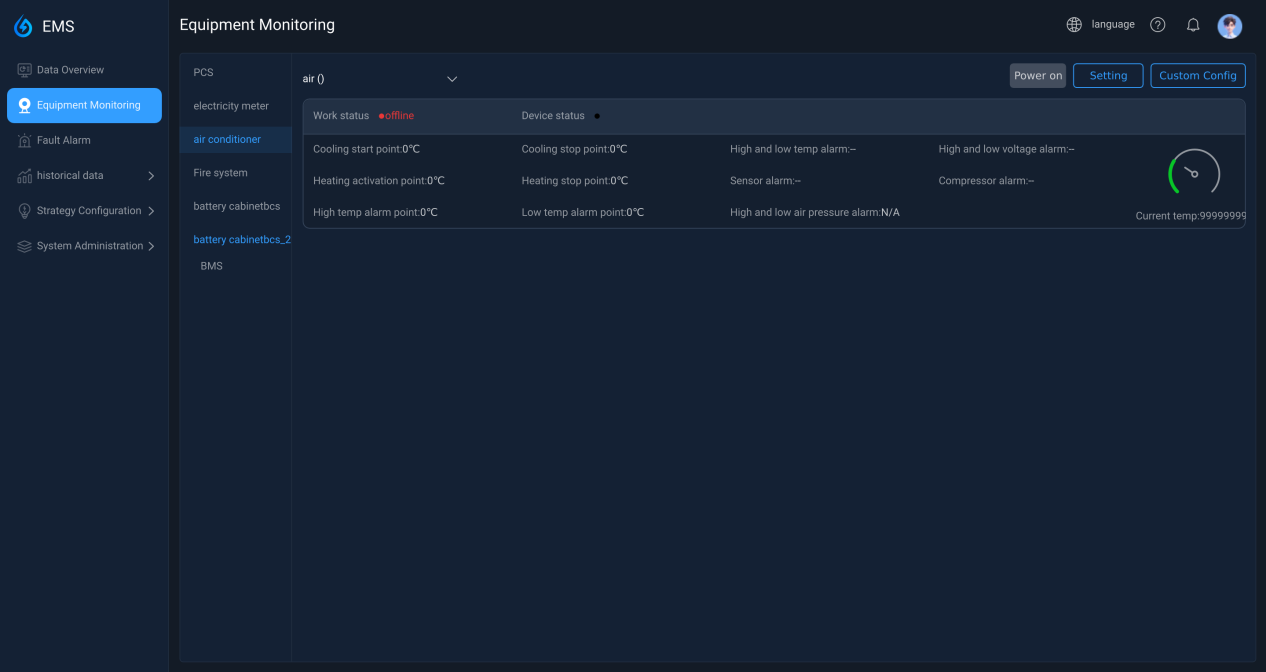
5.4 Air conditioner
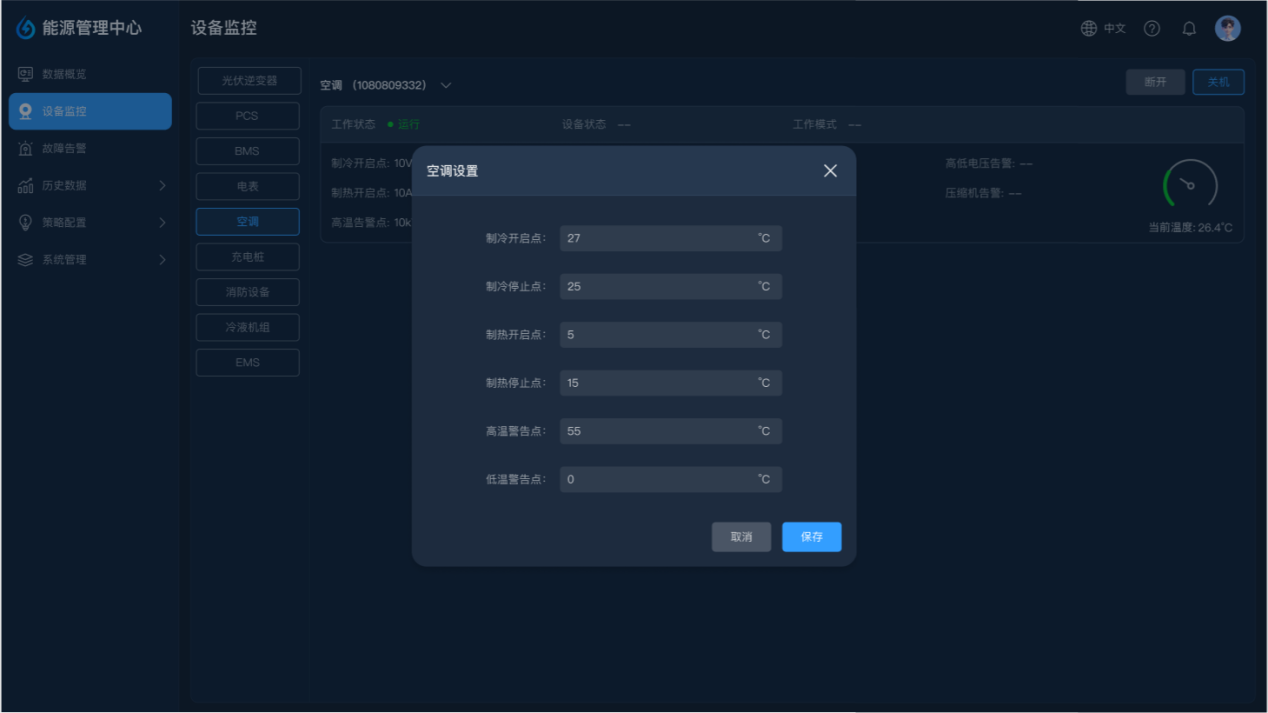
This interface is used to display air conditioner data and manage air conditioner configuration.
6. Fault alarm
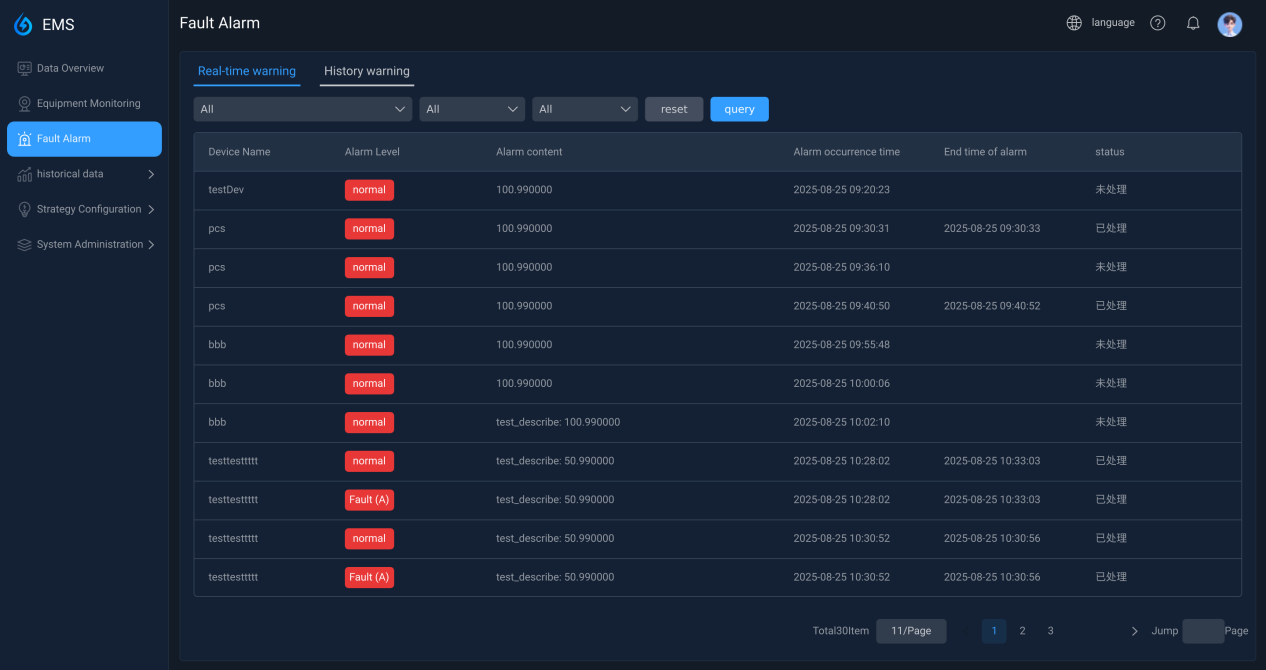
The fault alarm interface can view the current unresolved faults and historical faults.
In addition, you can filter by device, alarm level, alarm status, and start and end time to quickly obtain the required data.
7. Historical data
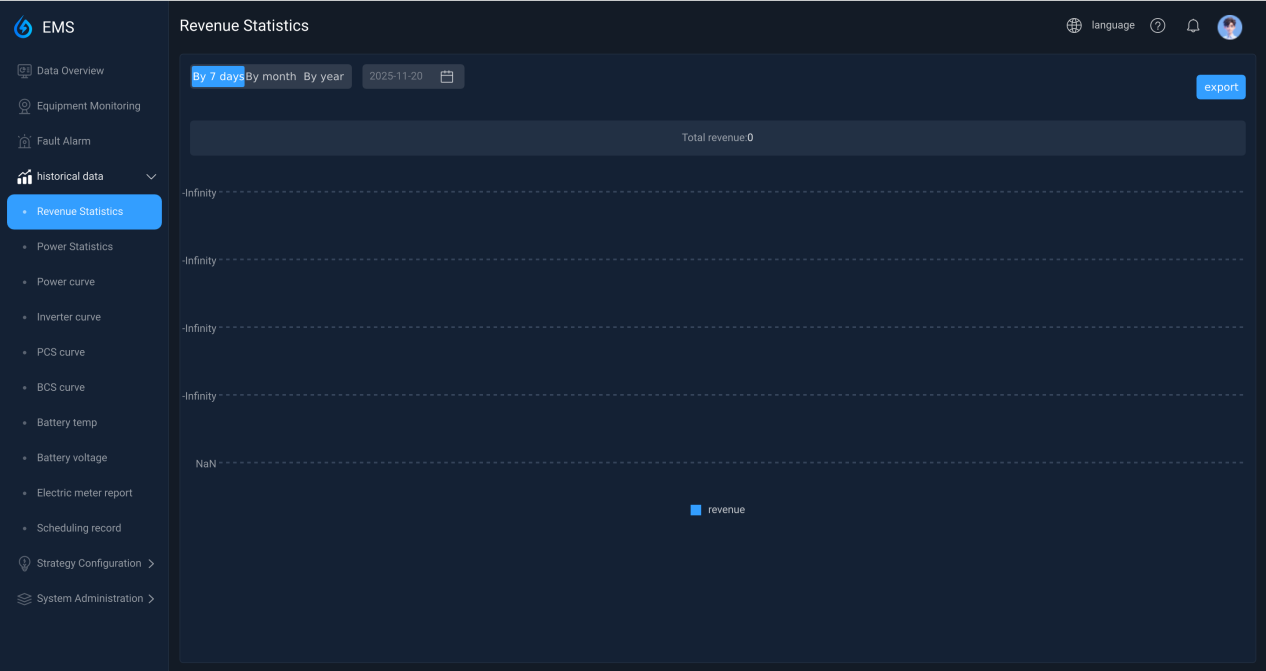
7.1 Revenue Statistics
The interface displays historical revenue data. You can view records for the past 7 days, a whole month, or a whole year from the selected date and support export.
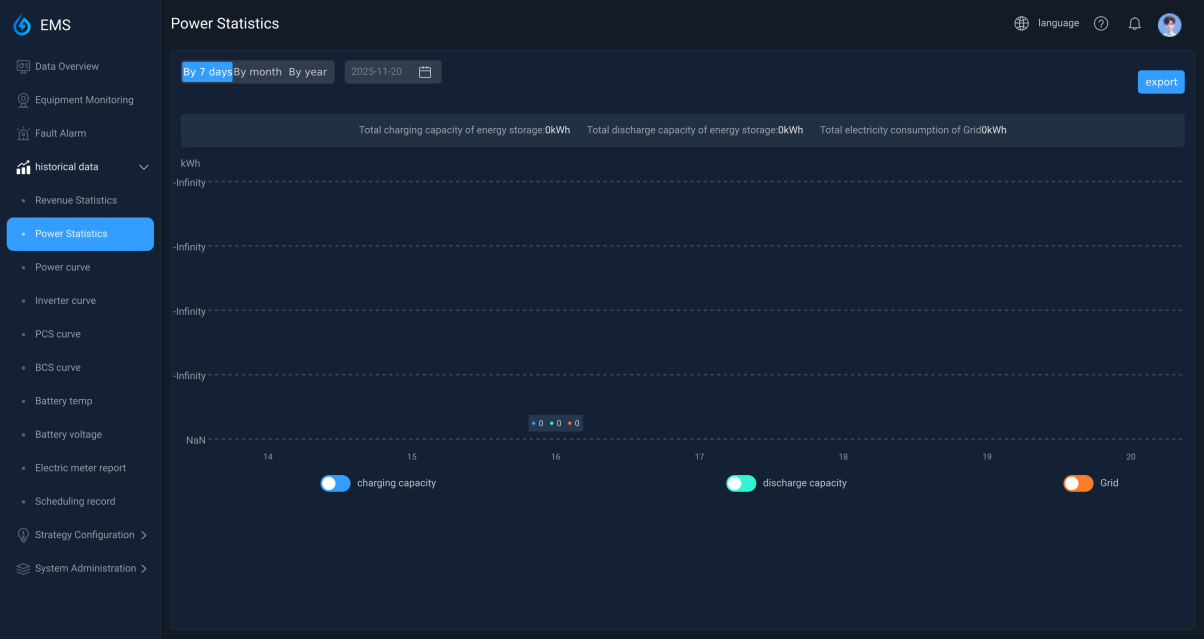
7.2 Power statistics
This interface displays electricity consumption data. You can view records for the past 7 days, a whole month, or a whole year from the selected date and support export.
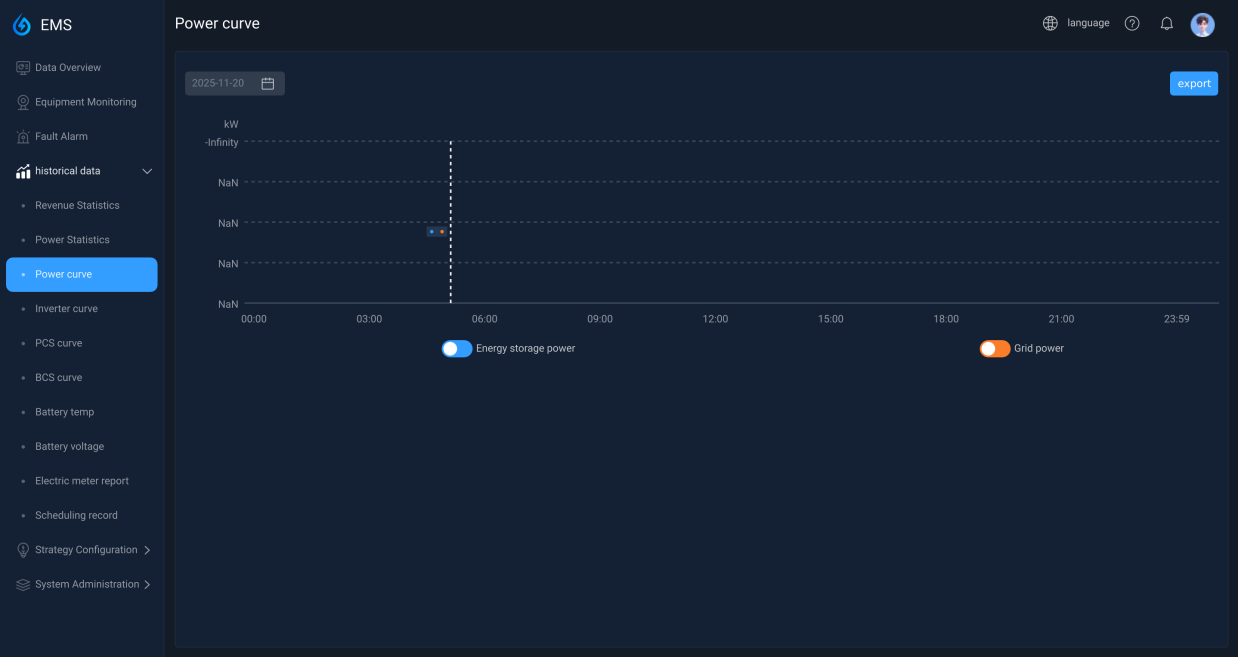
7.3 Power curve
This interface displays the power change curve, supports daily viewing and data export.
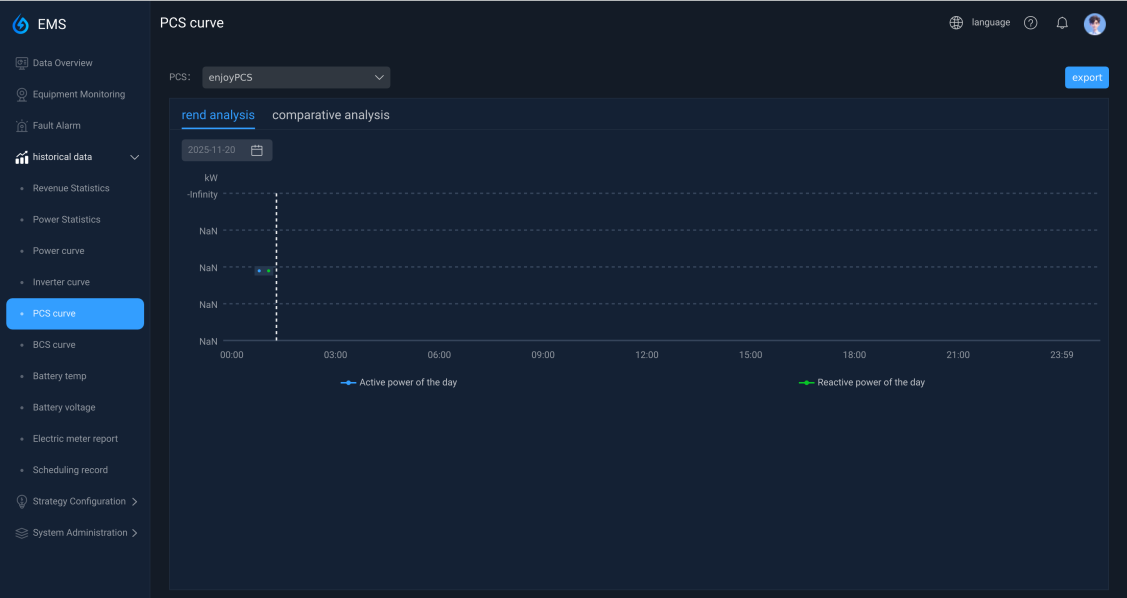
7.4 PCS Curve
This interface displays the PCS change curve. You can select and view data by device name or date, and export it. Trend analysis displays data for the selected date, while comparative analysis displays data for the selected date and the previous day.
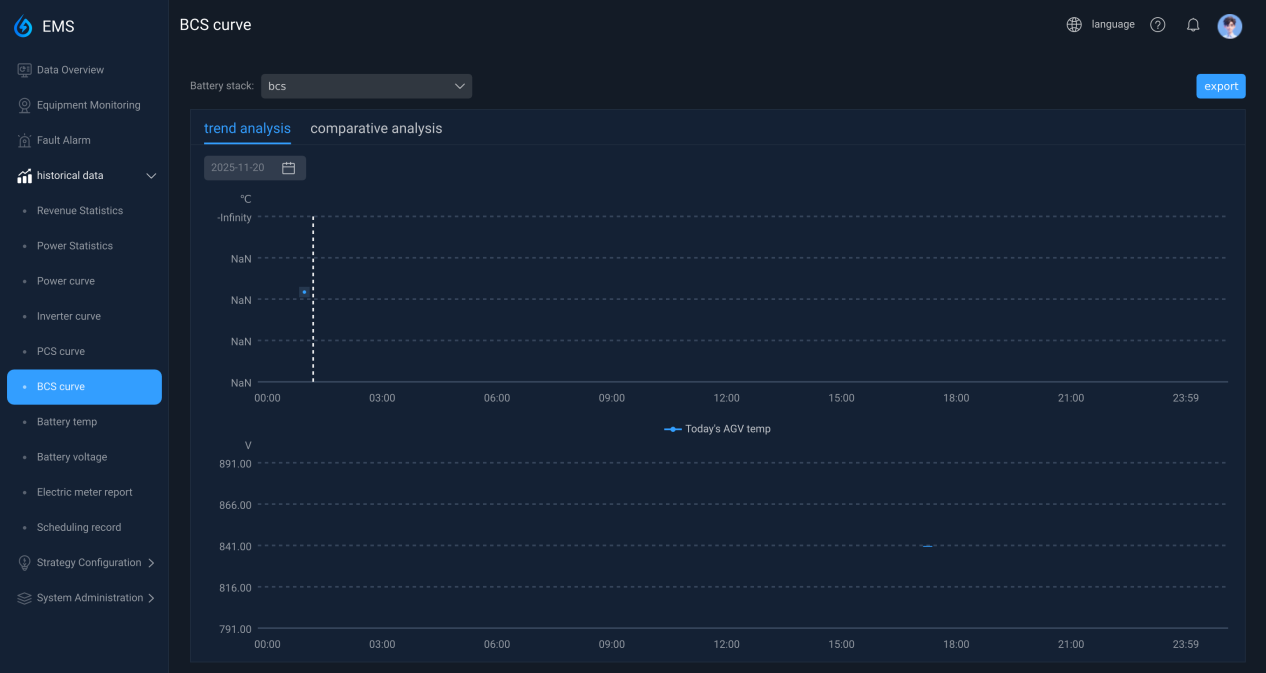
7.5 BMS curve
This interface displays BMS data curves. You can select and view data by device name or date, and export them. Trend analysis displays data for the selected date, while comparative analysis displays data for the selected date and the previous day.
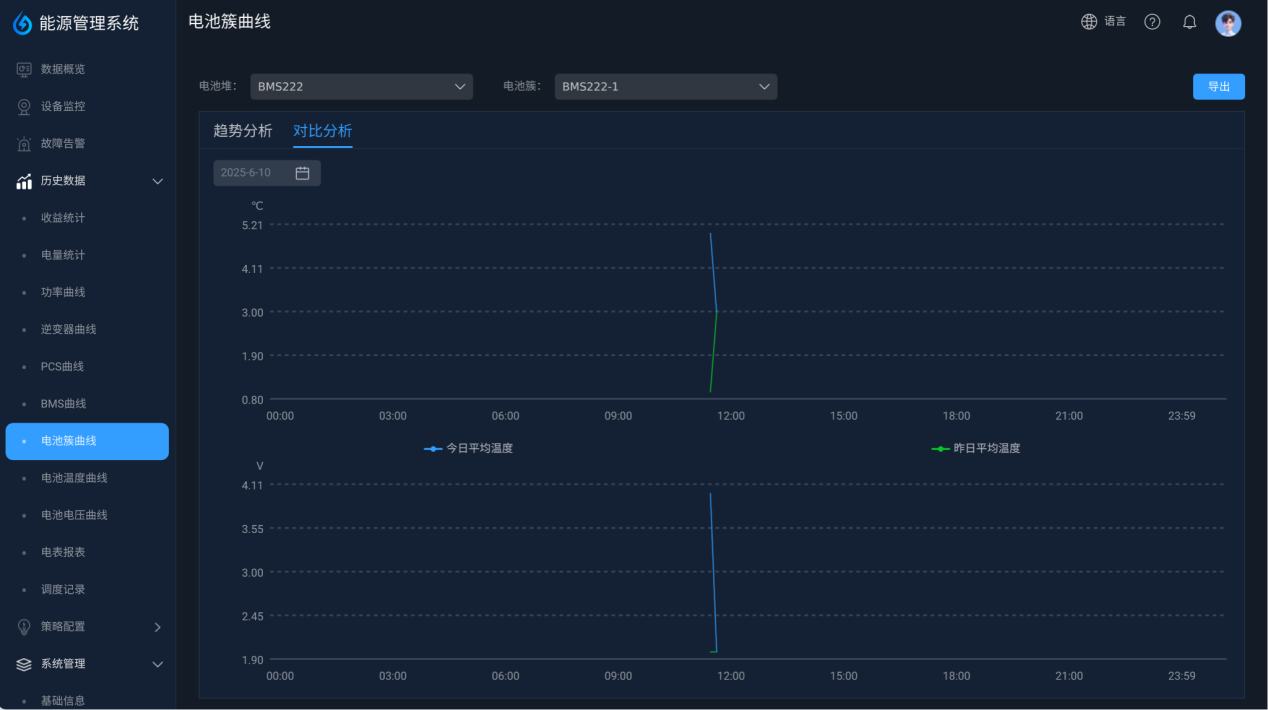
7.6 Battery cluster curve
This screen displays battery cluster data curves. You can select and view data by device name, cluster number, or date, and export them. Trend analysis displays data for the selected date, while comparative analysis displays data for the selected date and the previous day.
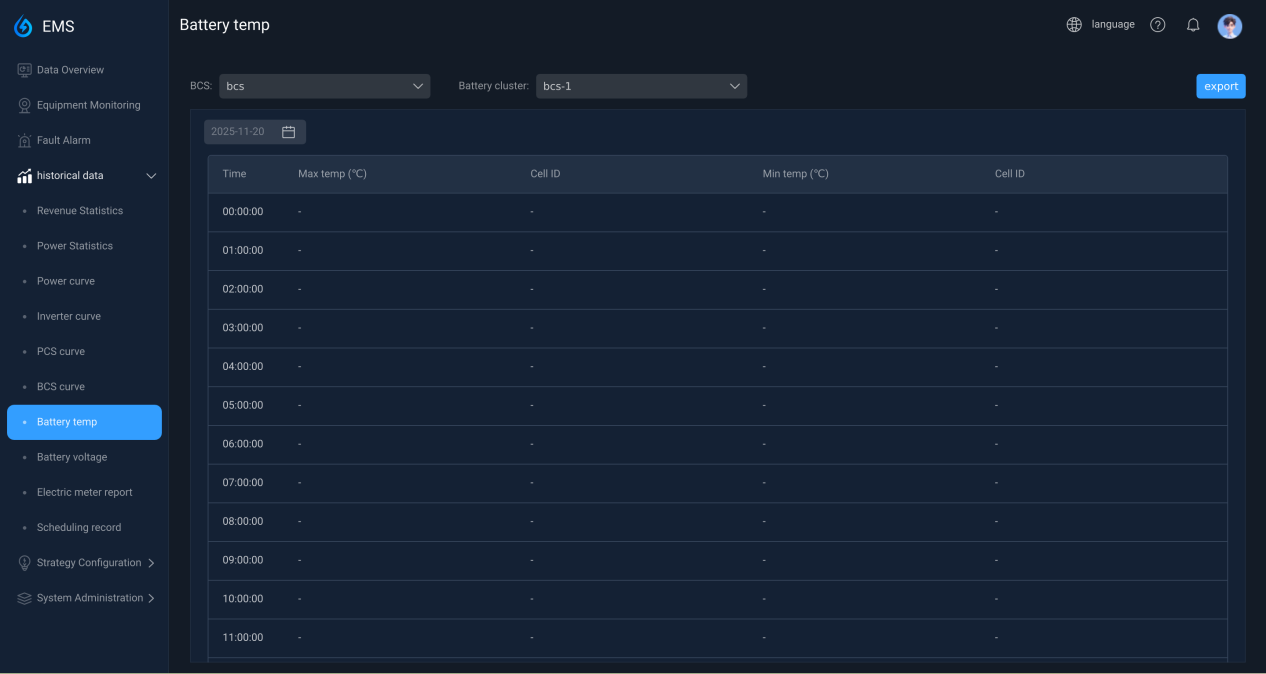
7.7 Battery temperature curve
This interface displays the battery temperature curve. You can view and export the data by device name, cluster N, or date.
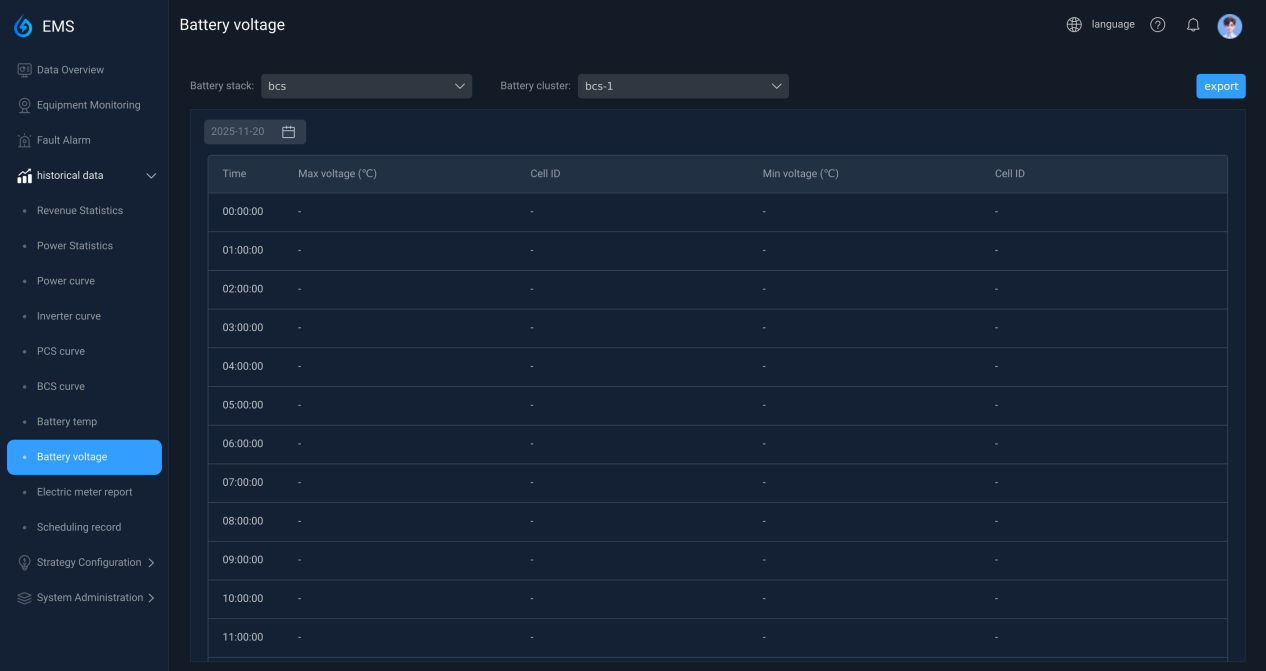
7.8 Battery voltage curve
This interface displays the battery voltage curve. You can view and export the curve by device name, cluster N, or date.
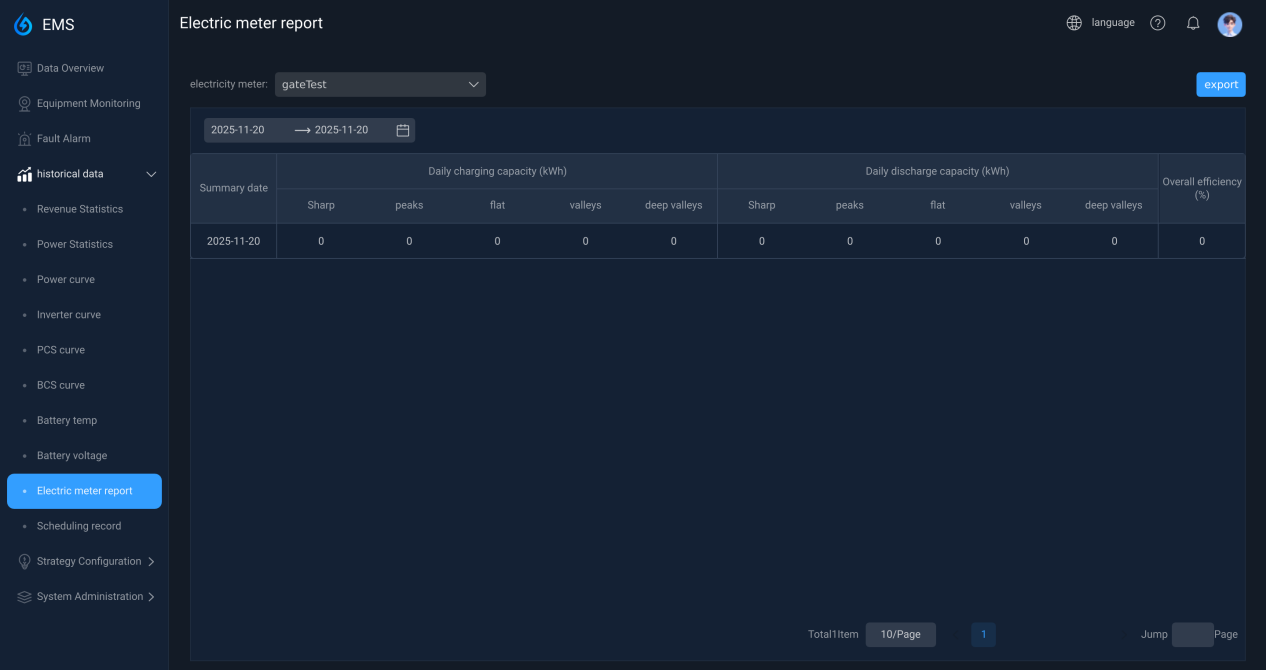
7.9 Electricity meter report
This interface displays meter charge and discharge data. You can select and view data by device name, start and end time, and export it.
8. Policy Configuration
8.1 Strategy Display
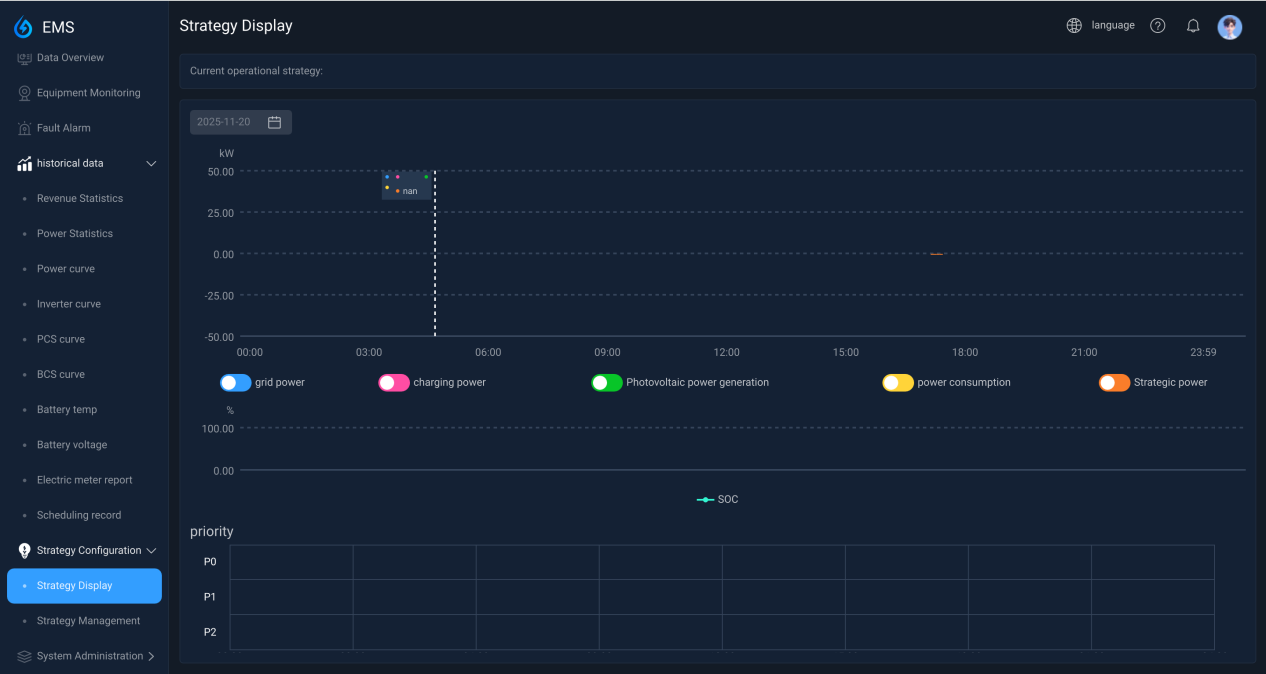
This interface displays the currently running strategy, and you can view the power values and SOC curve changes during the day by selecting a date. The bottom shows the strategy, strategy priority, and time period for the day.
8.2 Policy Management
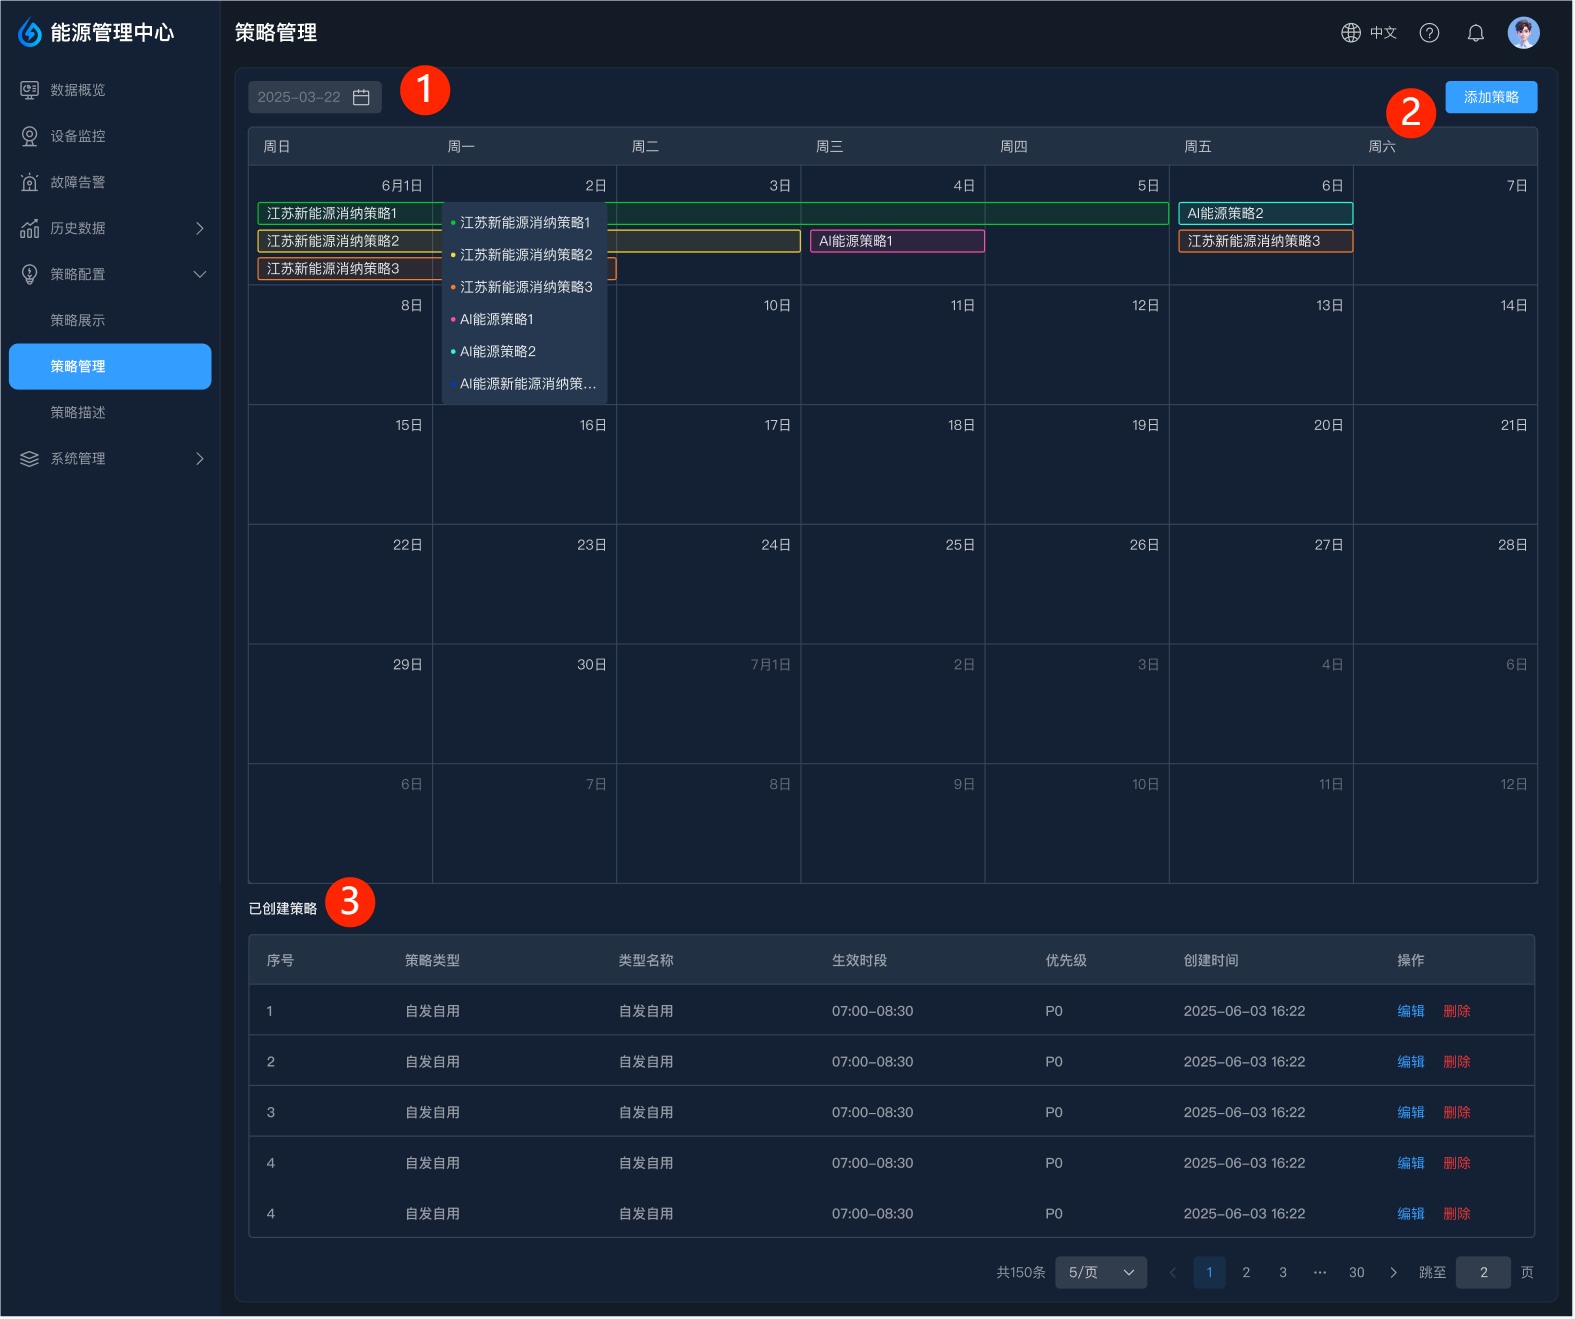
The policy management interface is shown in the figure below:
① Modify the selection for the current month.
② Add a policy.
③ View, edit, or delete all created policies.
8.3 Policy addition and modification
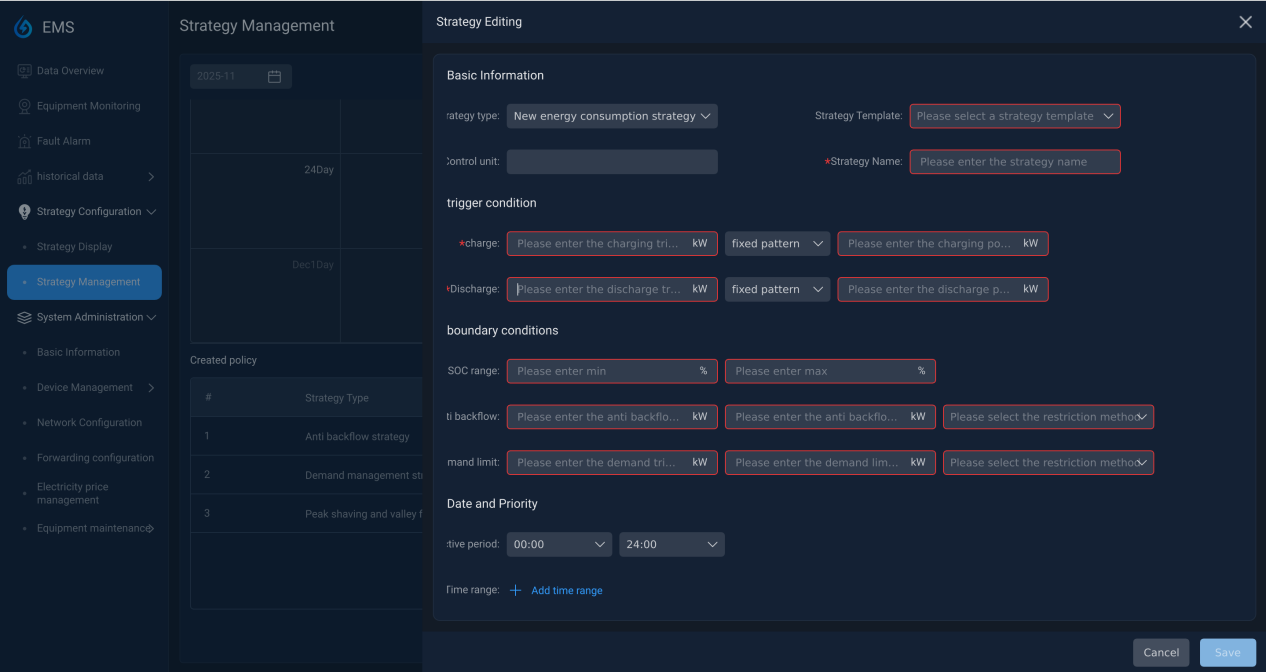
As shown in the figure below, in the policy add/edit interface:
① Basic information: Each strategy type must be filled in
| Strategy Type | You can choose "new energy consumption strategy", "peak shaving and valley filling strategy", "AI strategy", "anti-back flow strategy" and "demand management strategy". |
|---|---|
| Policy Templates | It is used to quickly fill in all the data below. You can use the preset blank template or load a similar template you have created. |
| Control unit | Select the unit that needs to be regulated by the current policy. |
| Policy Name | Enter a name for the policy. |
② Trigger conditions
| Charge | Set the charging type (grid tracking, fixed mode) and threshold. If you choose fixed mode, you also need to enter the power. |
|---|---|
| Discharge | Set the discharge type (load tracking, fixed mode) and threshold. If you select fixed mode, you also need to enter the power. |
③ Boundary conditions
| SOC range | Set lower and upper limits. |
|---|---|
| Anti-back flow | Set the trigger value, limit value, and limit method (allow charging, stop discharging). |
| Demand limitation | Set the trigger value, limit value, and limit method (allow charging, stop discharging). |
④ Date and priority
| Effective period | The range is 00:00 ~ 24:00. |
|---|---|
| Time range | You can add as many non-contiguous ranges as you like. |
| Priority | P0~P9, the highest priority is P0. |
9. System Management
9.1 Basic Information
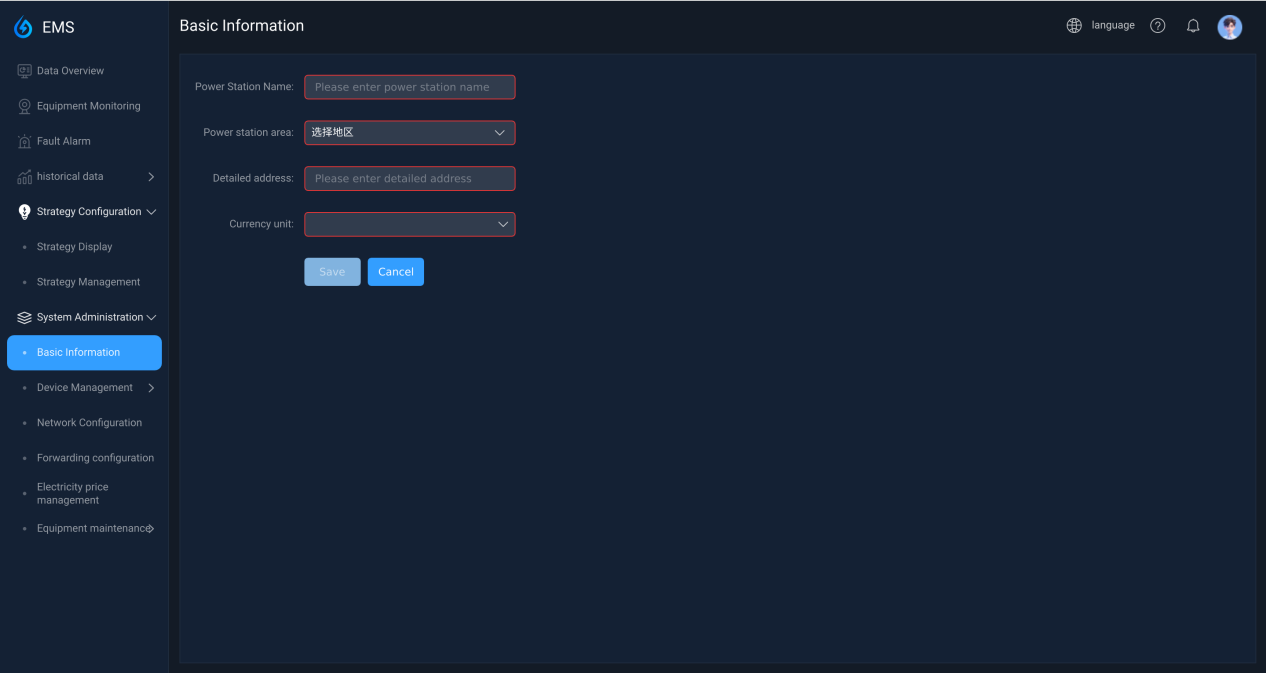
- Power station name: Enter the power station name.
- Power plant region: Select a province, city, or district.
- Detailed address: Fill in the address by yourself.
- Time zone setting: range: UTC-12 ~ UTC+12.
- Currency unit: Currently only US dollar, euro and RMB.
9.2 Device Management
9.2.1 Unit Management
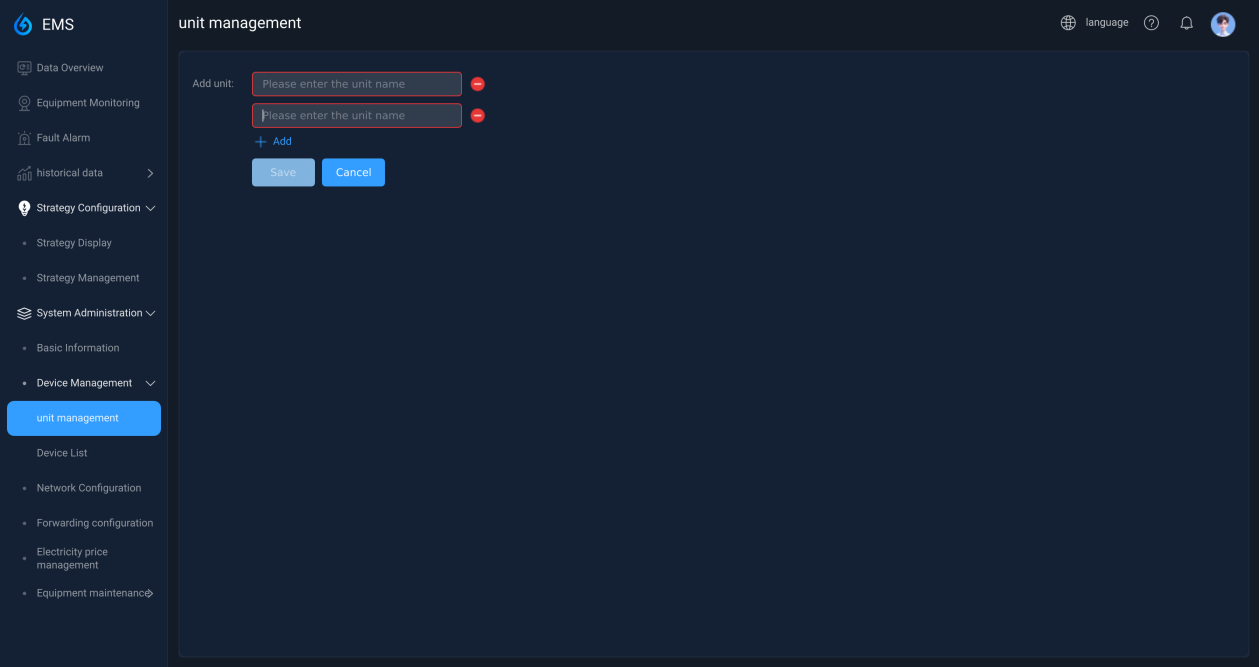
Before adding a device, you need to set the unit and name. When adding devices later, you need to select the device based on the unit type.
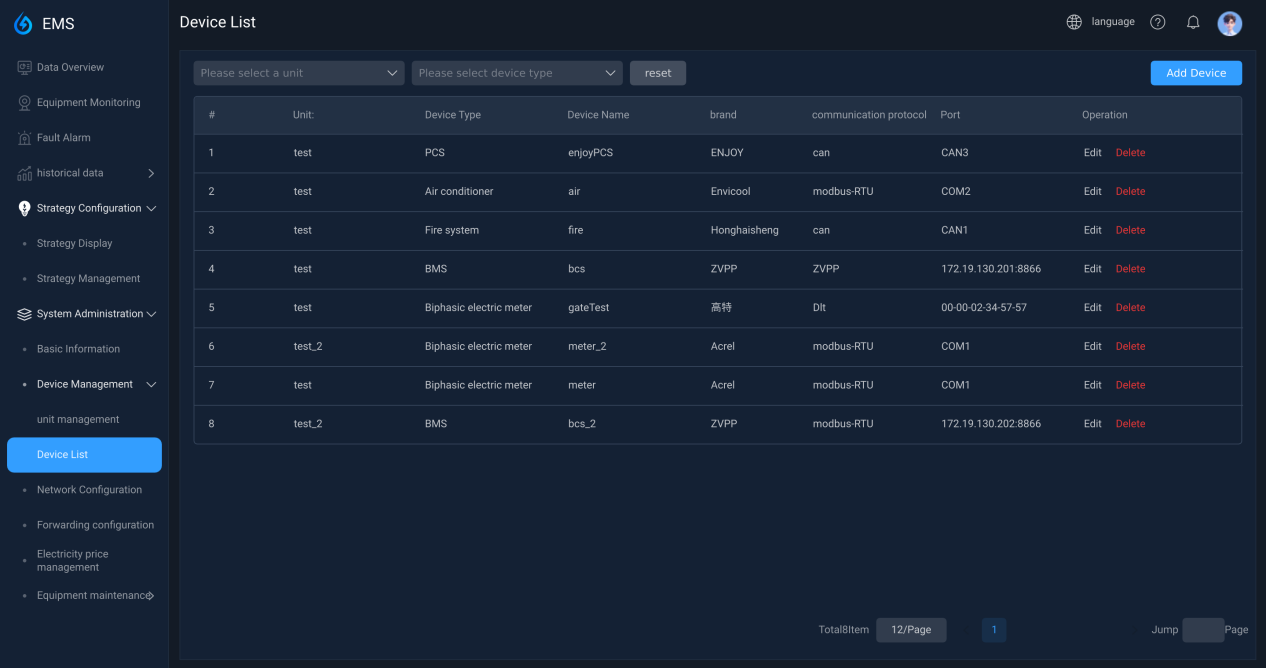
9.2.2 Equipment List
You can filter and view by unit and device type.
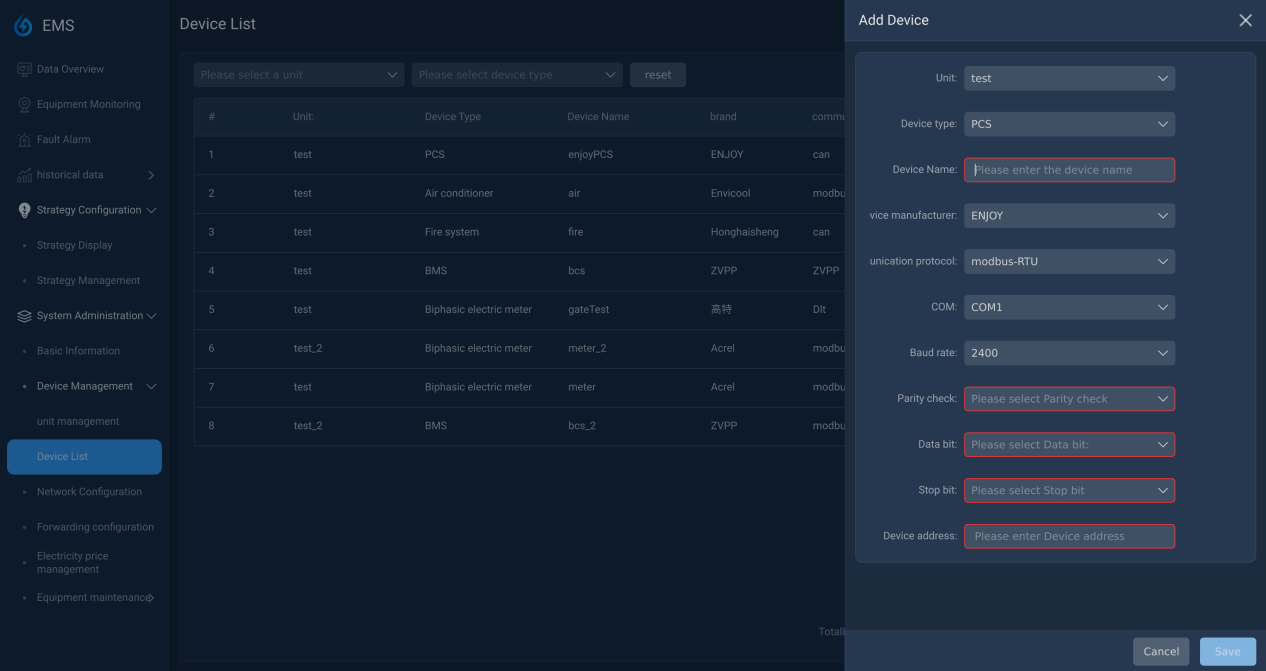
Adding and editing devices:
- Unit: The options in the drop-down box are based on the unit management configuration.
- Equipment Type: Varies according to the type of unit it belongs to.
- Device Name: Give the device a name.
- Equipment Manufacturer: The manufacturer of the equipment.
- Communication type: Currently supports modbus-RTU, modebus-TCP, CAN, DLT, ZVPP. The selected protocol type will determine the specific configuration parameters to be filled in below. The parameter requirements corresponding to each protocol are as follows:
- Modbus-RTU: COM, baud rate, parity, data bits, stop bits.
- Modbus-TCP, ZVPP: IP address, port number.
- can: CAN port, baud rate.
- Dlt: Dlt address.
- Device Address: The address of the device.
9.3 Network Configuration
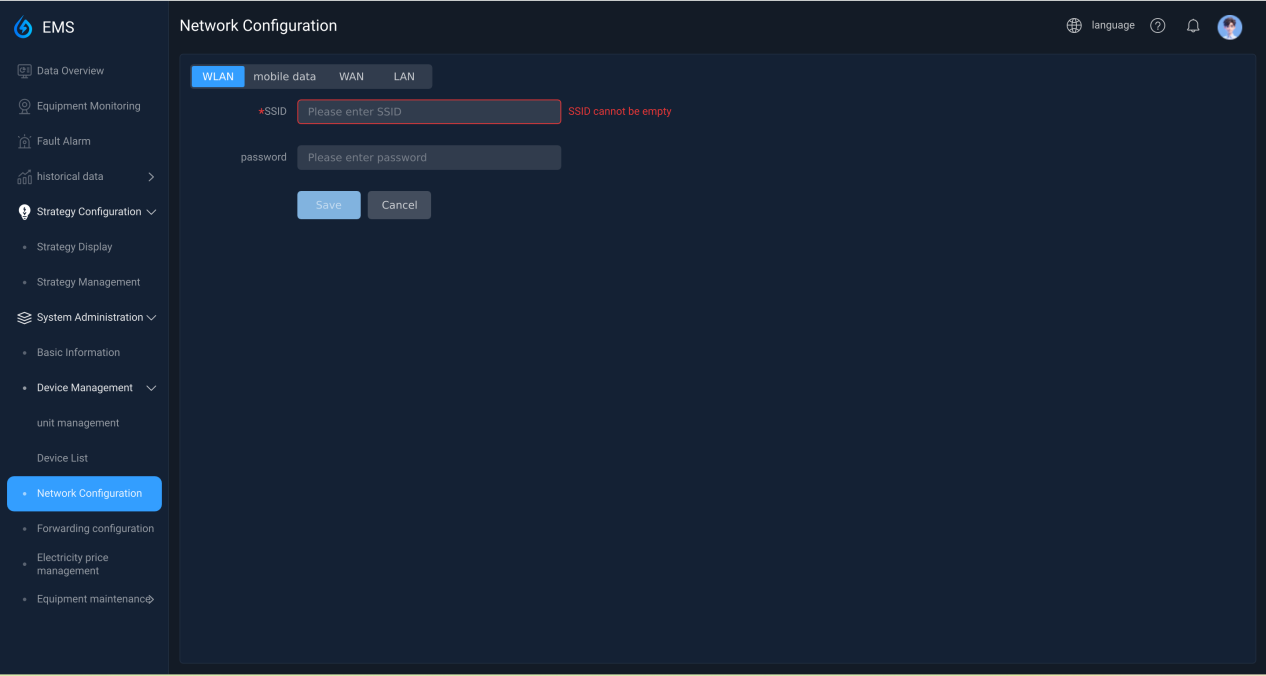
9.3.1 WLAN
Enter/modify the SSID and password.
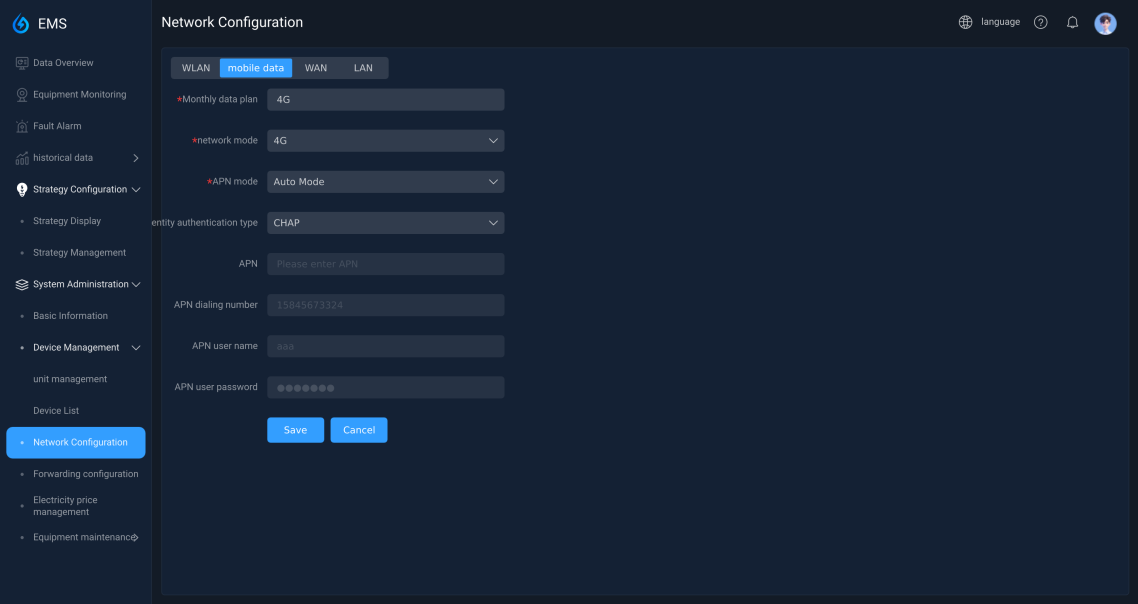
9.3.2 Mobile data
- Monthly data package: the amount of data available per month (unit: GB).
- Network mode: Auto, 2G, 3G, 4G.
- APN mode: automatic mode, manual mode.
- Authentication type: CHAP, manual mode.
- When the APN mode is manual, you need to fill in: APN, dial-up number, user name, and user password.
9.3.3 WAN
- If you obtain the IP automatically, you do not need to fill in the following content.
- If the IP address is not obtained automatically, you need to fill in: IP address, subnet mask, gateway address, preferred DNS server, and alternative DNS server.
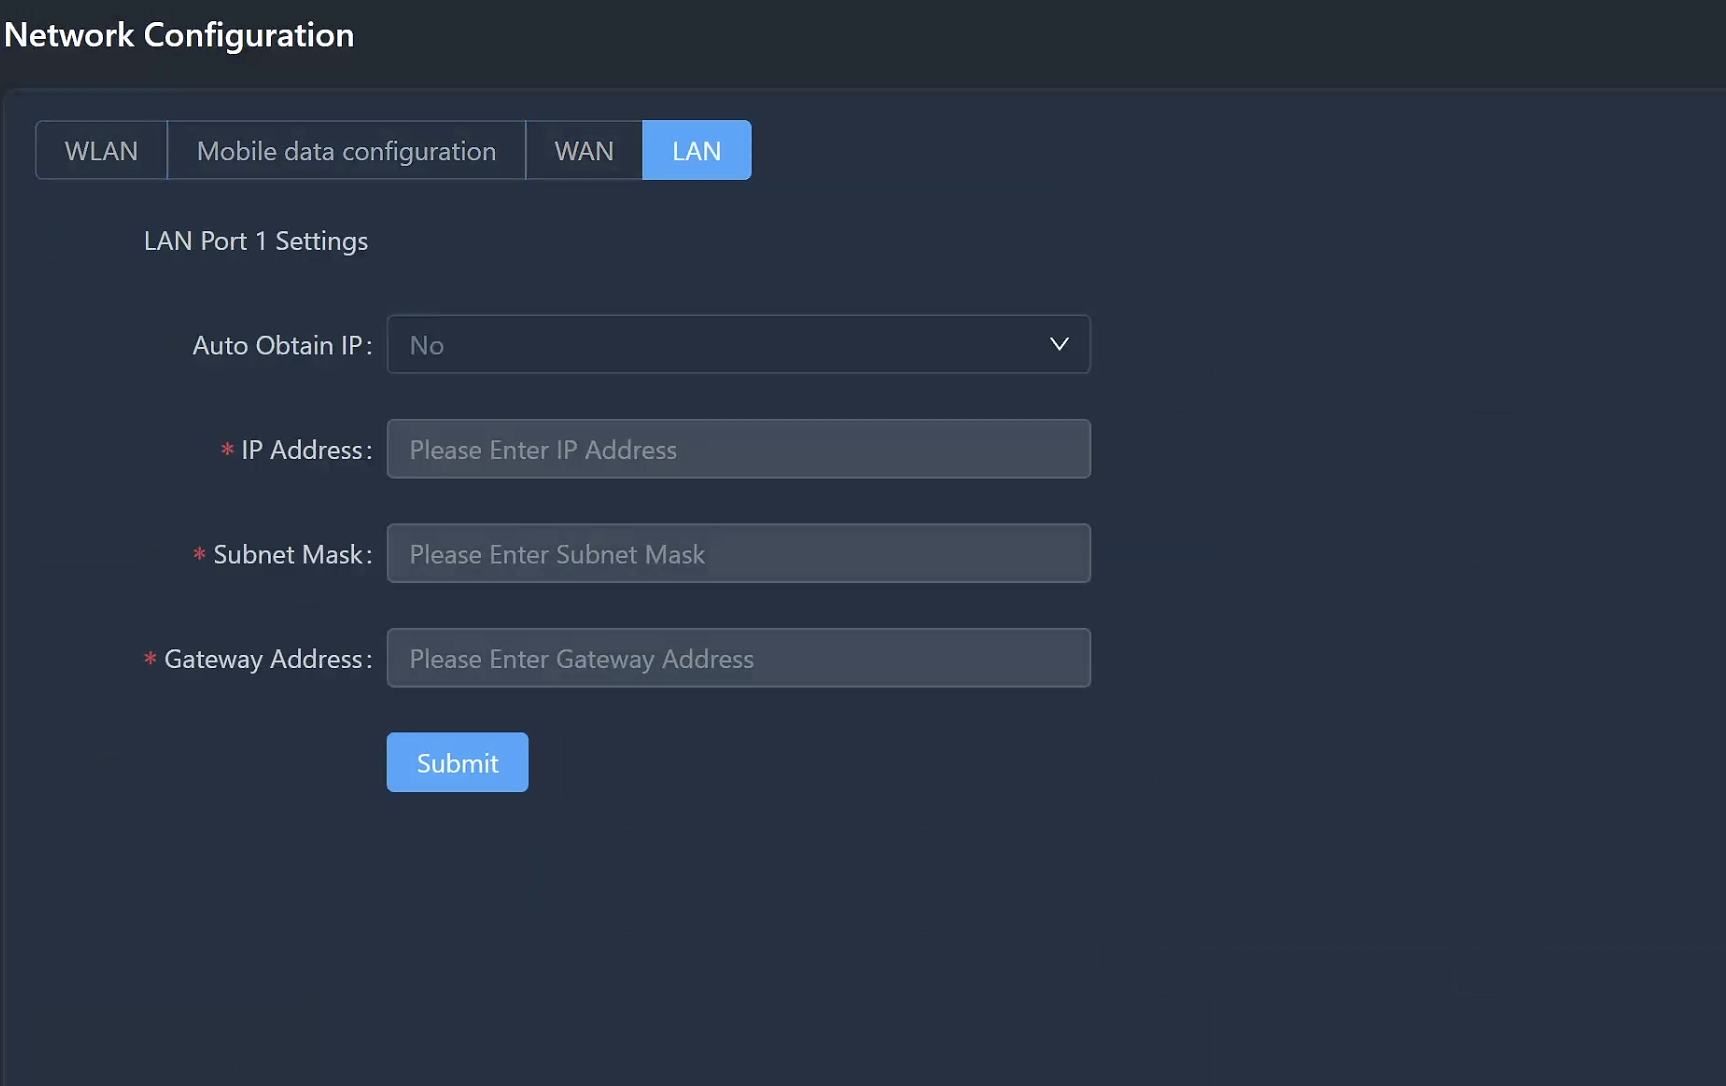
9.3.4 LAN
Configure whether to automatically obtain IP addresses. If you manually obtain IP addresses, you need to enter the IP address, subnet mask, and gateway address.
9.4 Forwarding Configuration
Not currently available.
9.5 Electricity Price Management
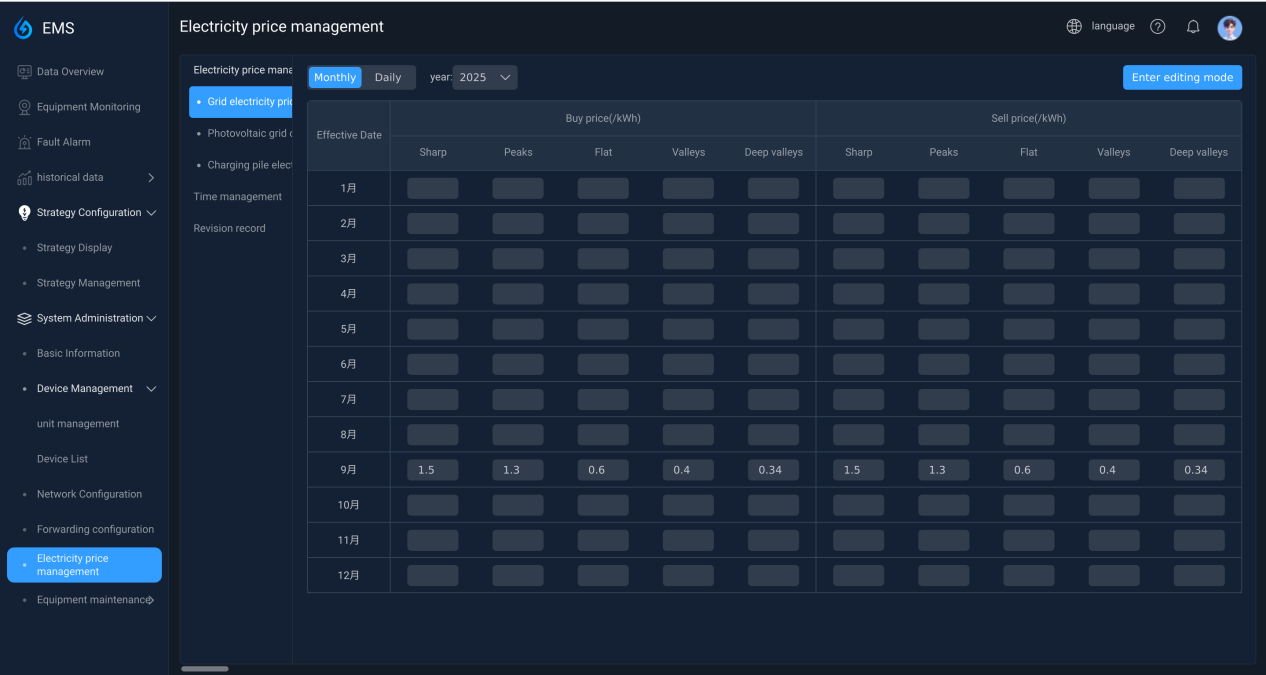
9.5.1 Grid electricity prices
View electricity prices by month/day. Click to enter edit mode to edit.
- View by month: Select a year from the drop-down box.
- View by day: Select the year and month from the drop-down box.
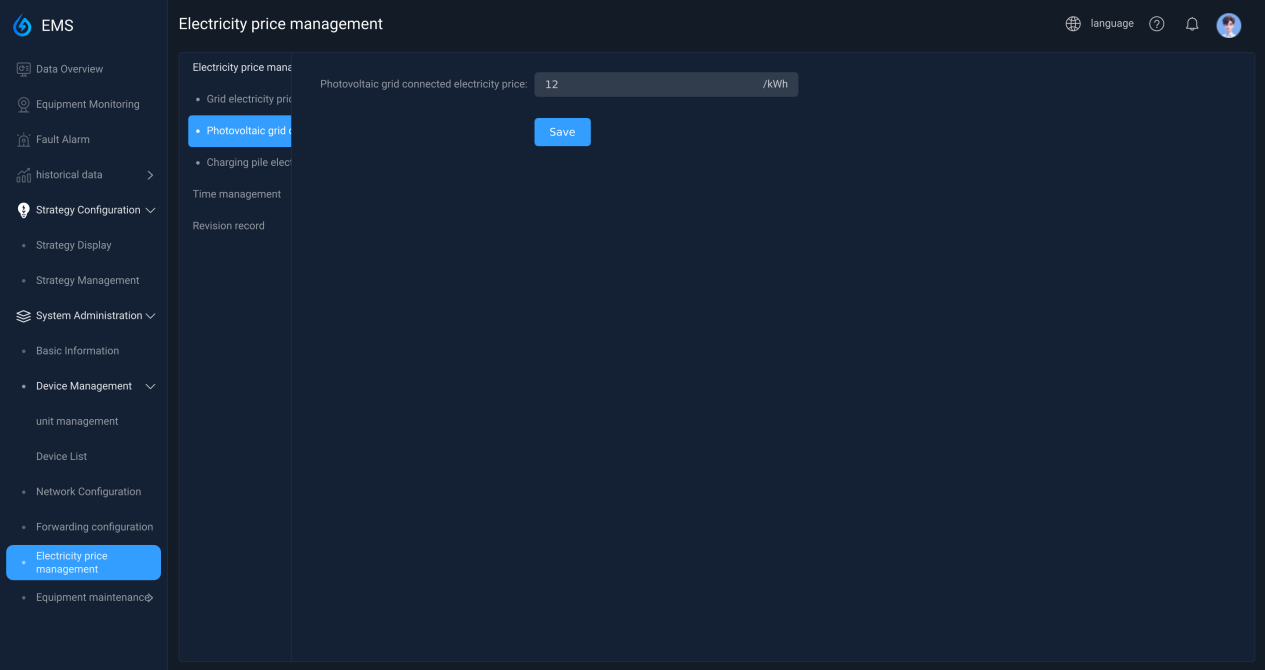
9.5.2 Photovoltaic grid-connected electricity price
Modify the photovoltaic grid-connected electricity price.
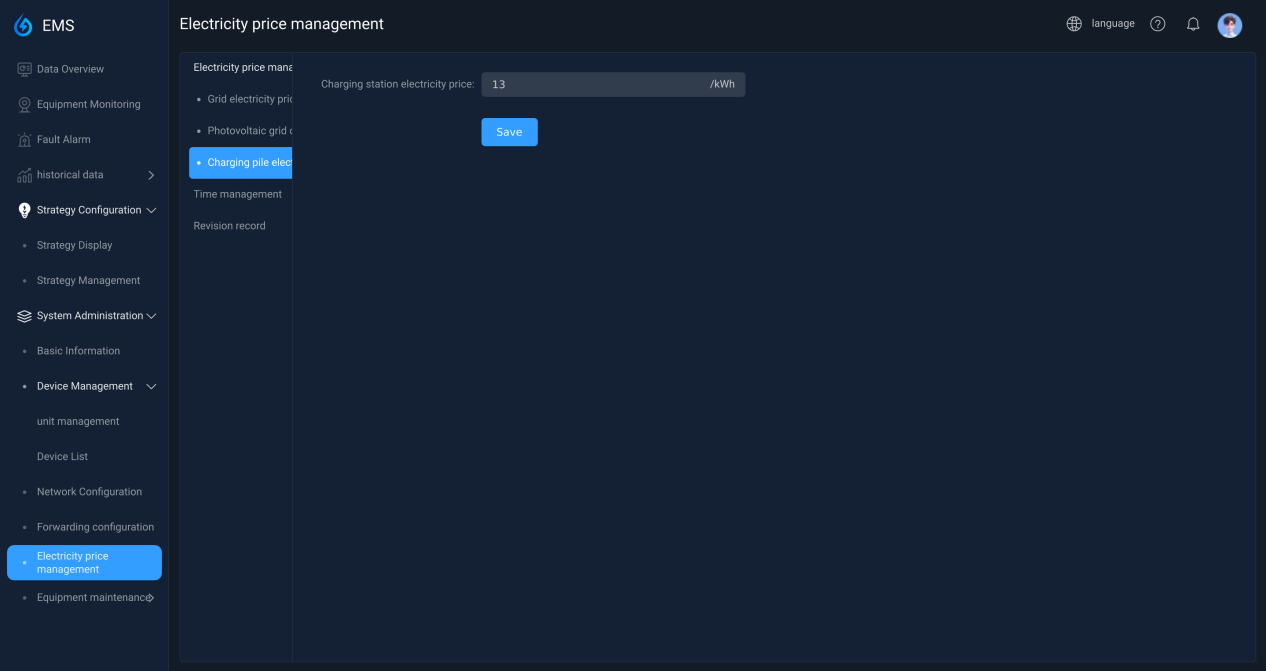
9.5.3 Charging pile electricity price
Modify the electricity price of charging piles.
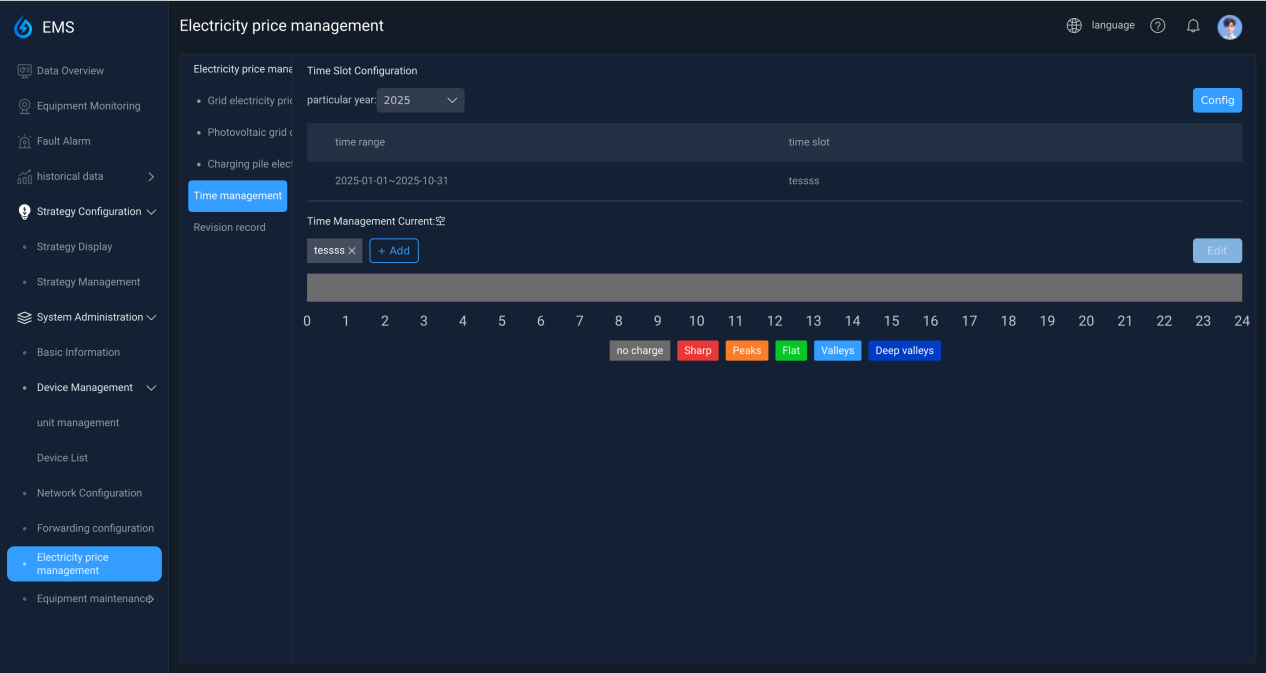
9.5.4 Time period management
① Filter and view time period data by year.
② Click to select a time period. The timeline color chart below will change according to the selected time period. Click Add to add, click X to delete, and click Edit on the right to modify.
③ Displays the time period configured for the year selected in ① and the time period it selected.
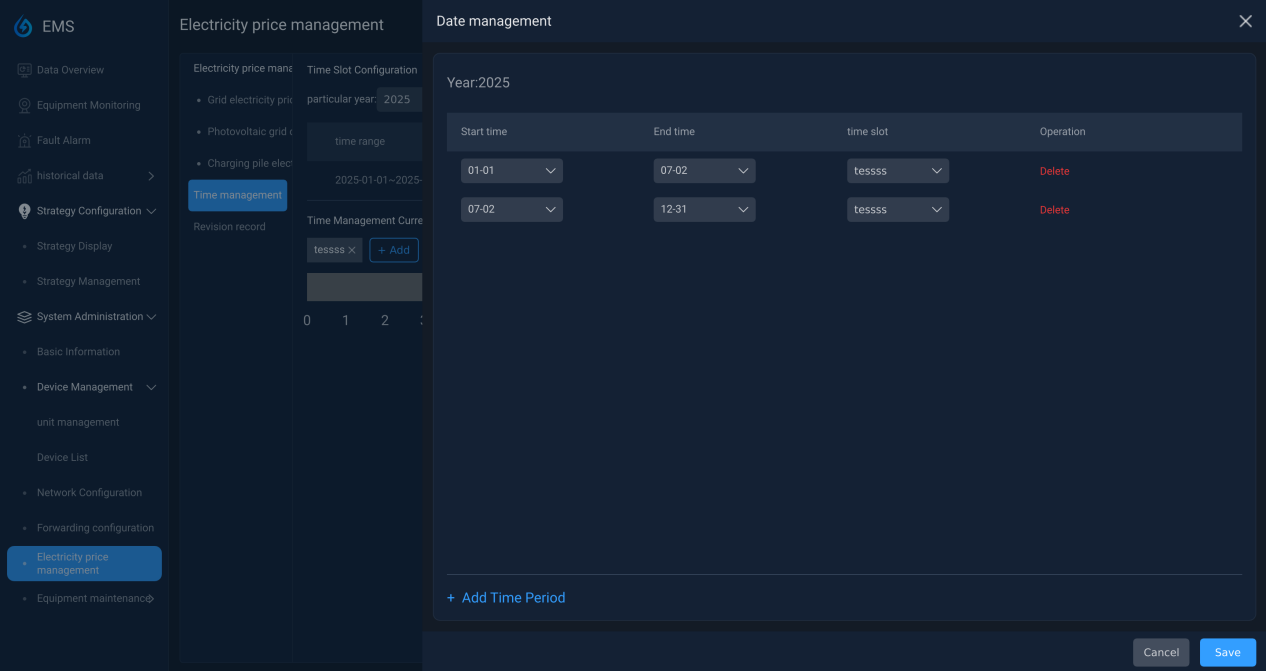
④ Click Configure to enter the following interface, where you can add or edit time periods. The time periods on this interface correspond to the list in Figure ② above.
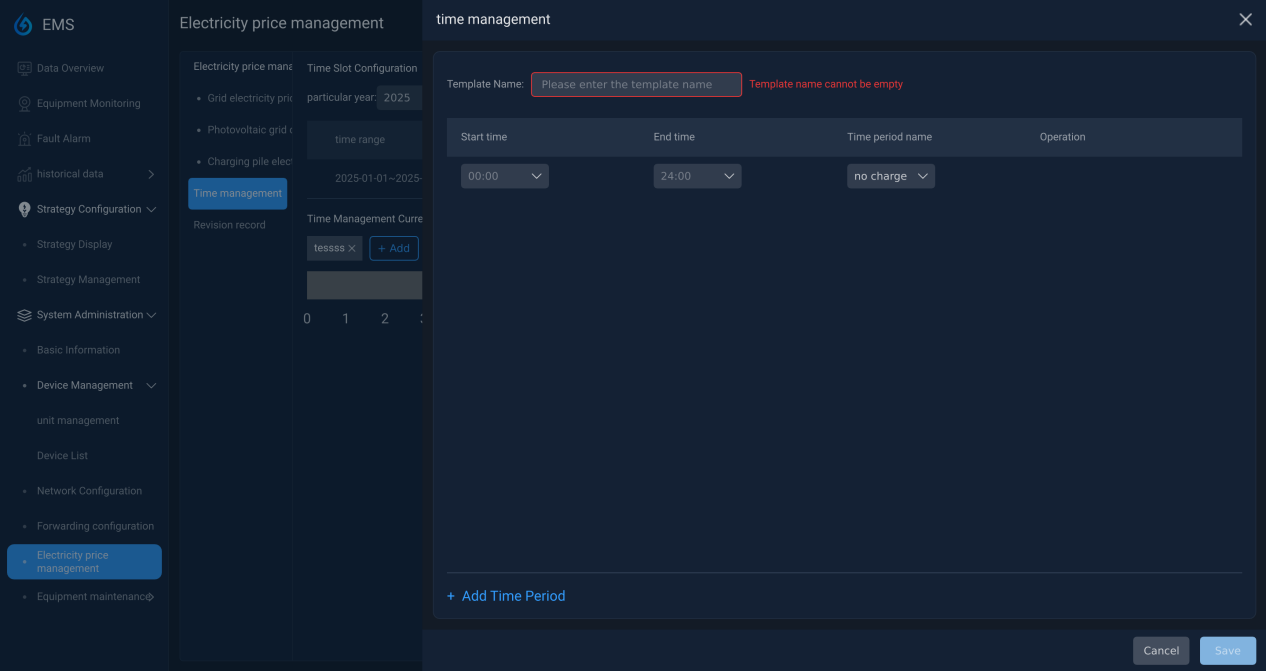
⑤ Click Edit to enter the following interface (or click Add in ②).
Name the template, configure the time period, and select "Peak/Off-peak" or "No charge" from the drop-down box. After saving, the new template will be displayed in the area shown in Figure ②.
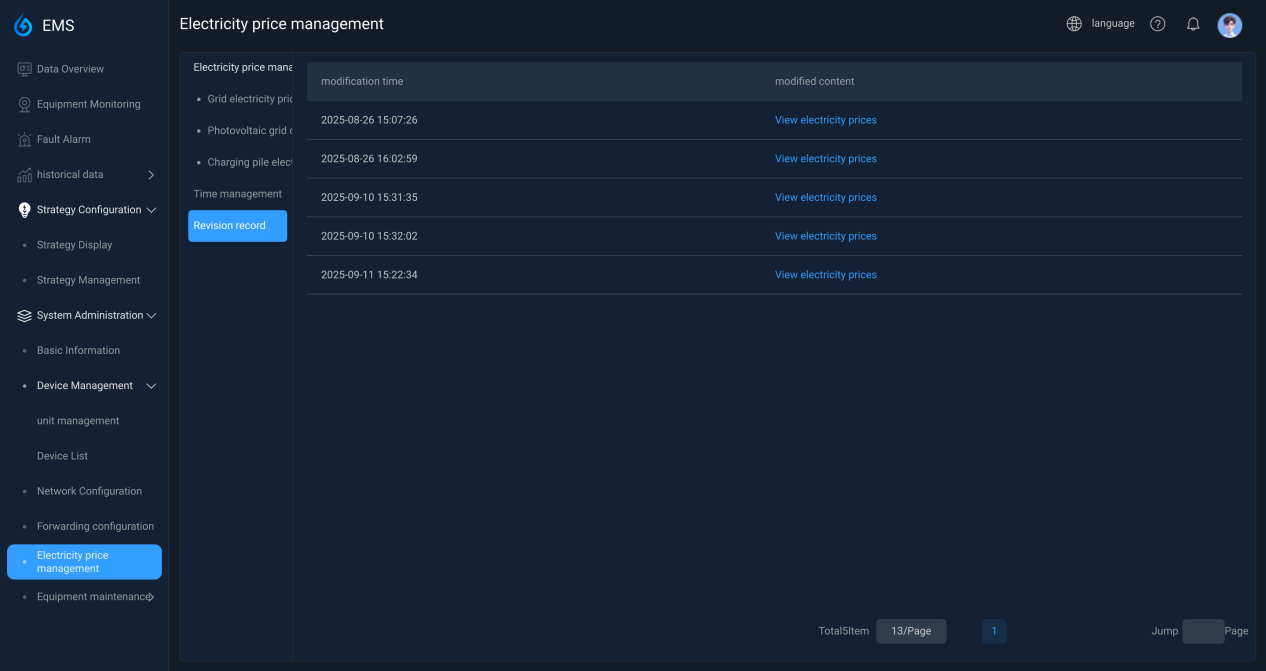
9.5.5 Modification Record
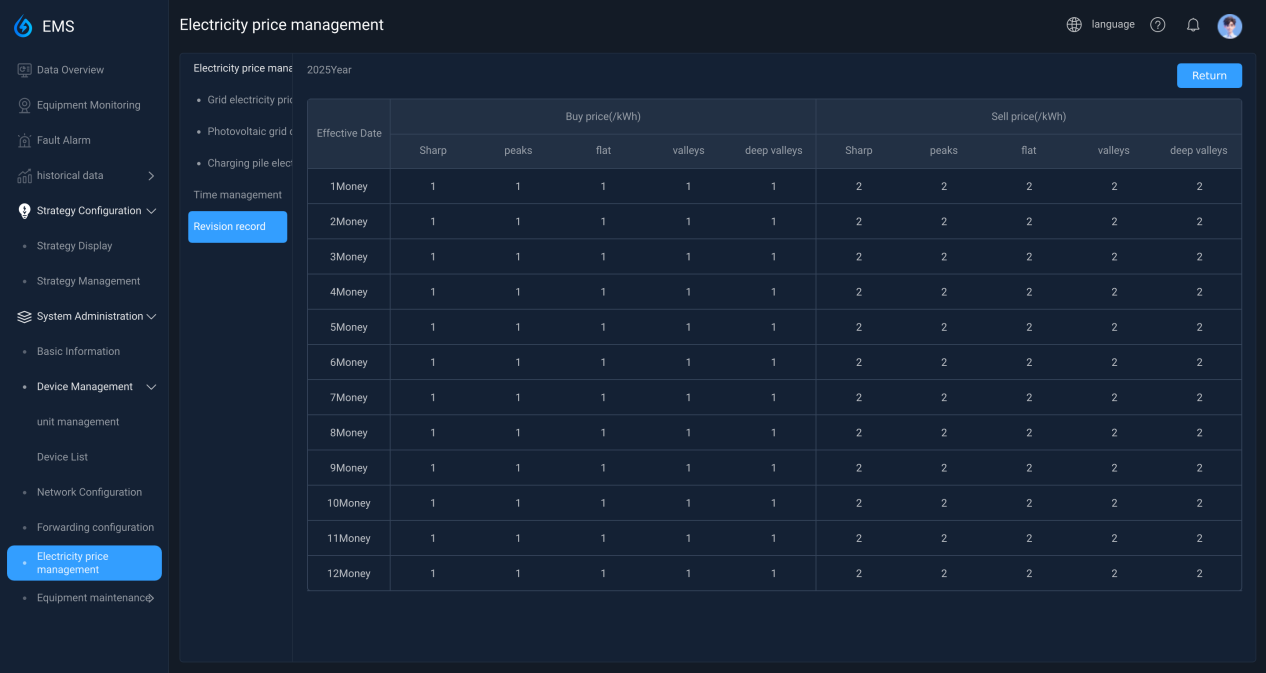
List all modification records. Clicking View Electricity Price will display an interface similar to 9.5.1 for viewing modification contents.
9.6 Equipment maintenance
9.6.1 Software upgrade
-
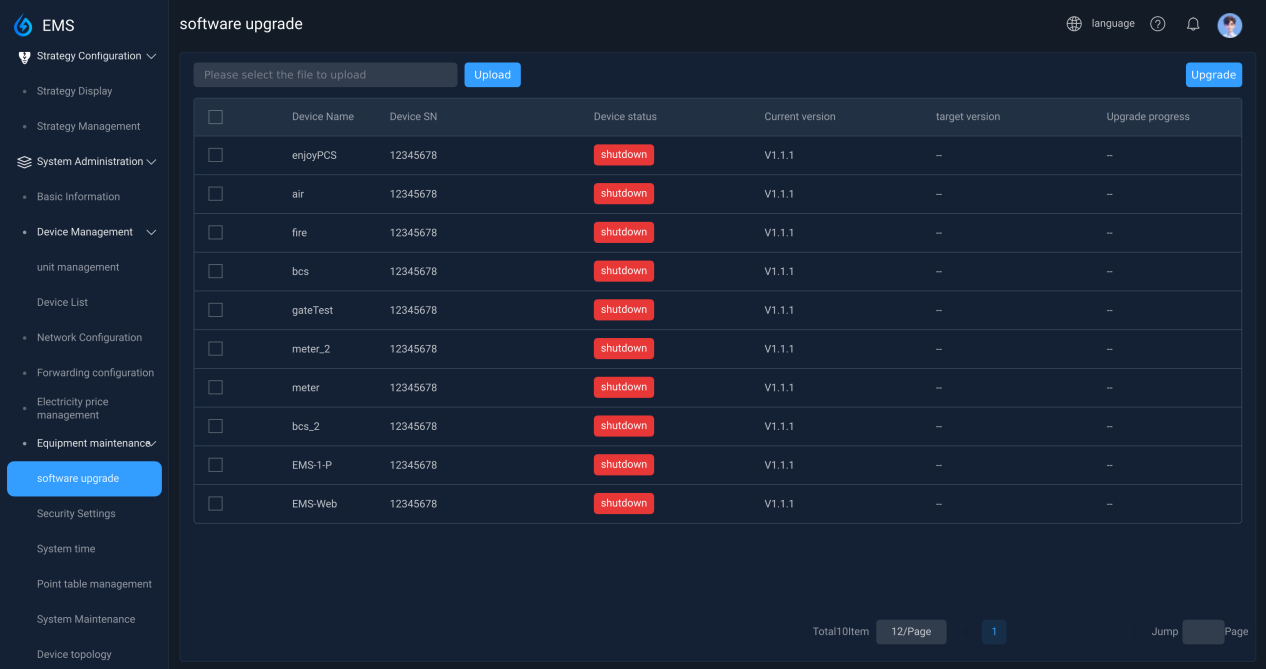
Click Upload to open the file selection dialog box for selecting the upgrade file to upload.
-
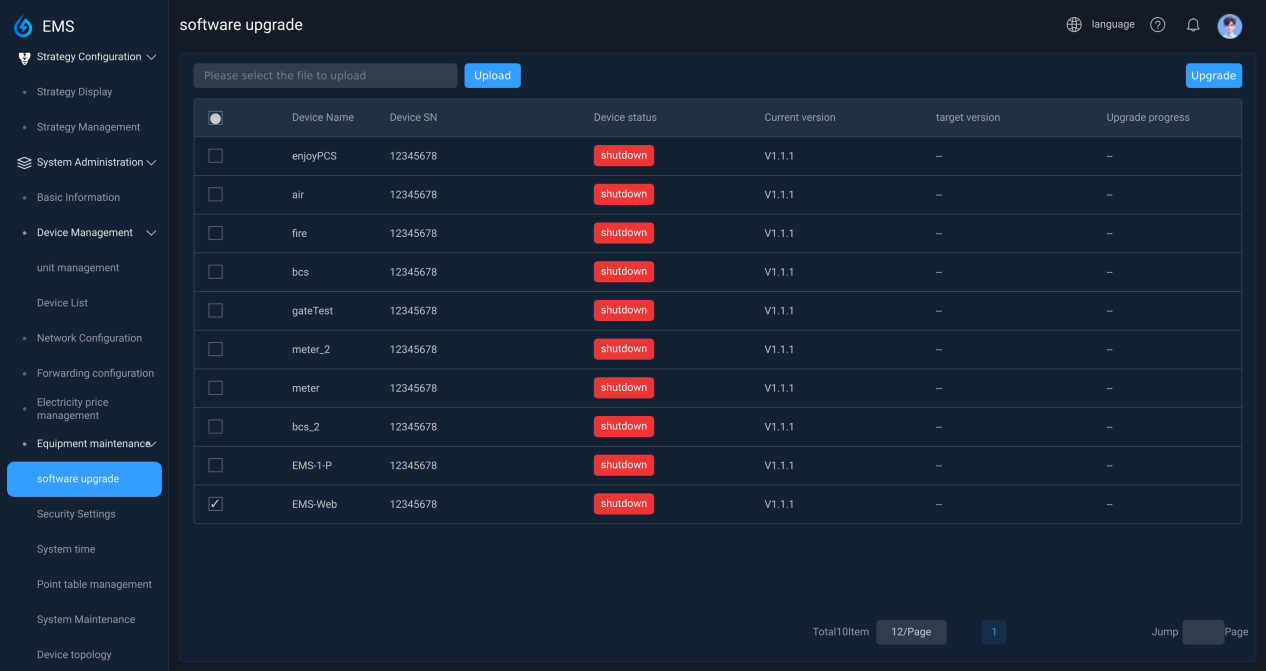
After selecting the device, click the Upgrade button to start the upgrade.
-
The device that starts the upgrade will update the target version and upgrade progress. During the upgrade process, no other operations can be performed.
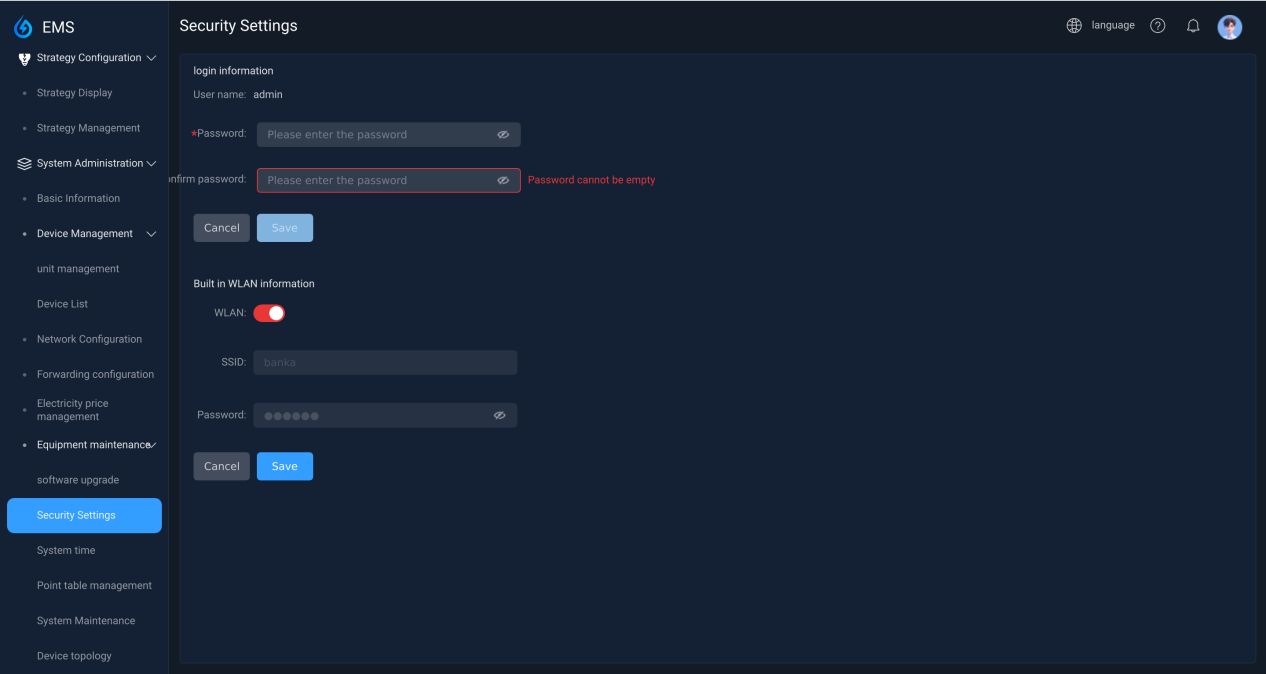
9.6.2 Security Settings
- Login information: Modify the current user's login password.
- Built-in WLAN information: Modify whether to enable, and set the SSID and password.
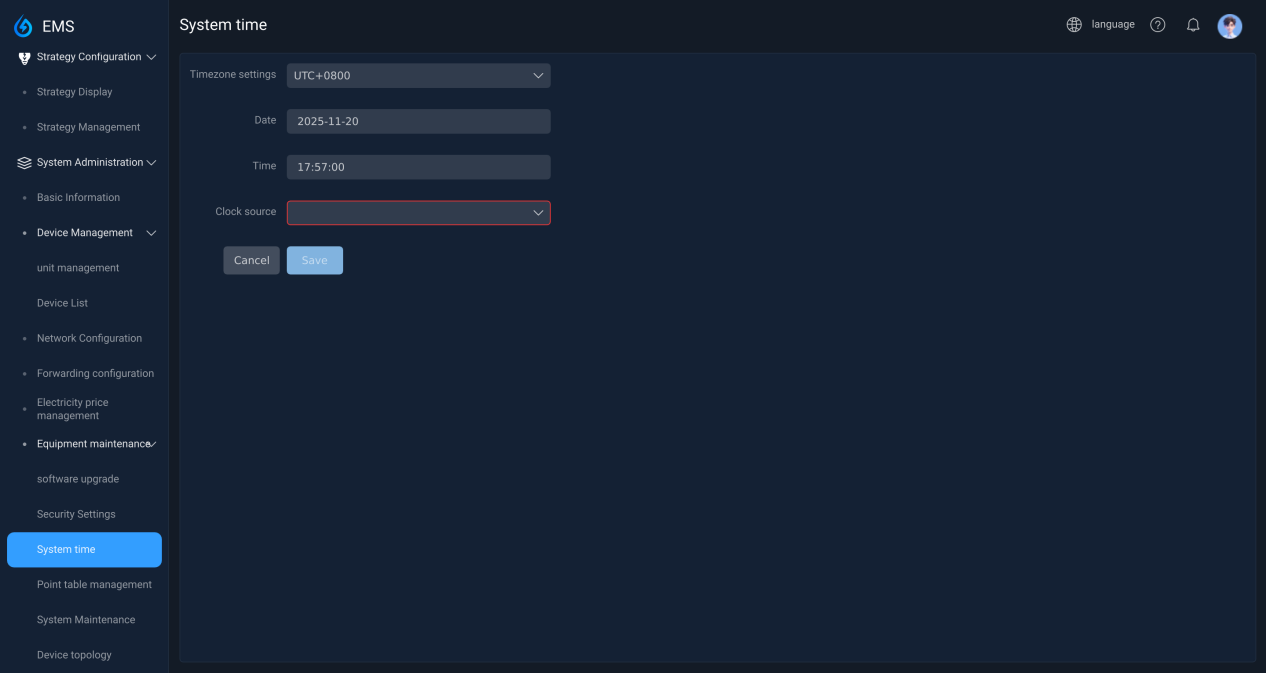
9.6.3 System time
- Time zone setting: UTC-12 ~ UTC+12
- Date and time: Fill in the date and time
- Clock source: NTP, management system, none
9.6.4 Point table management
Not currently available.
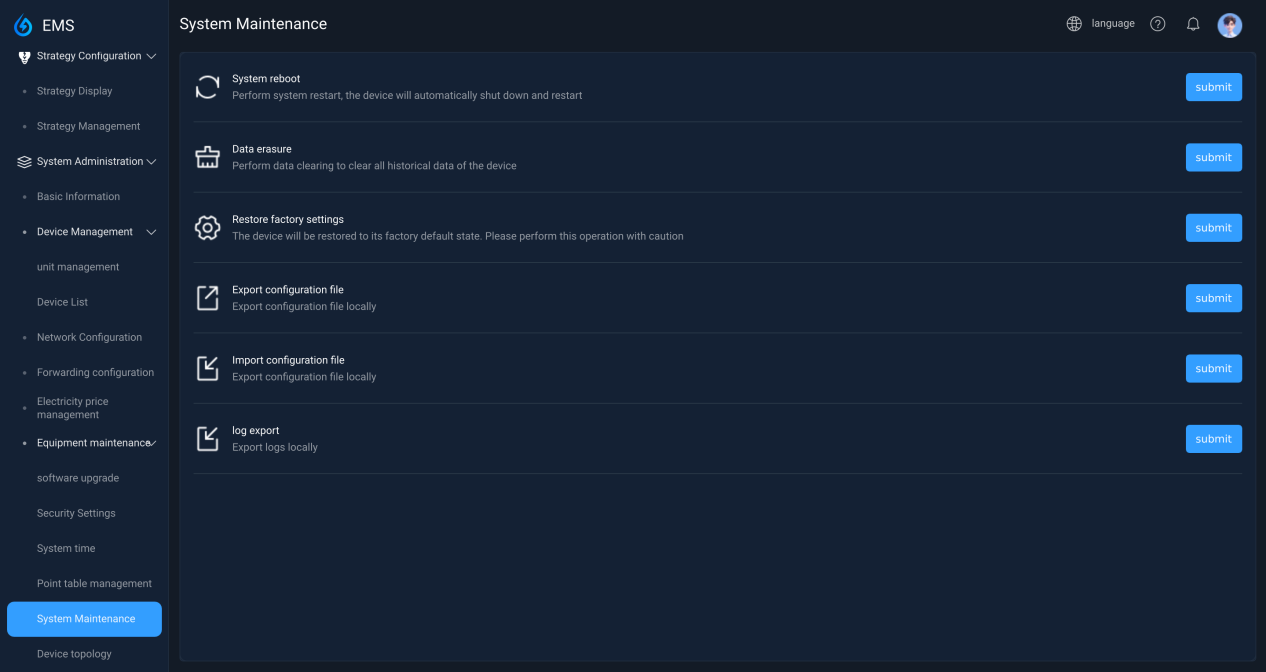
9.6.5 System Maintenance
9.6.6 Device topology
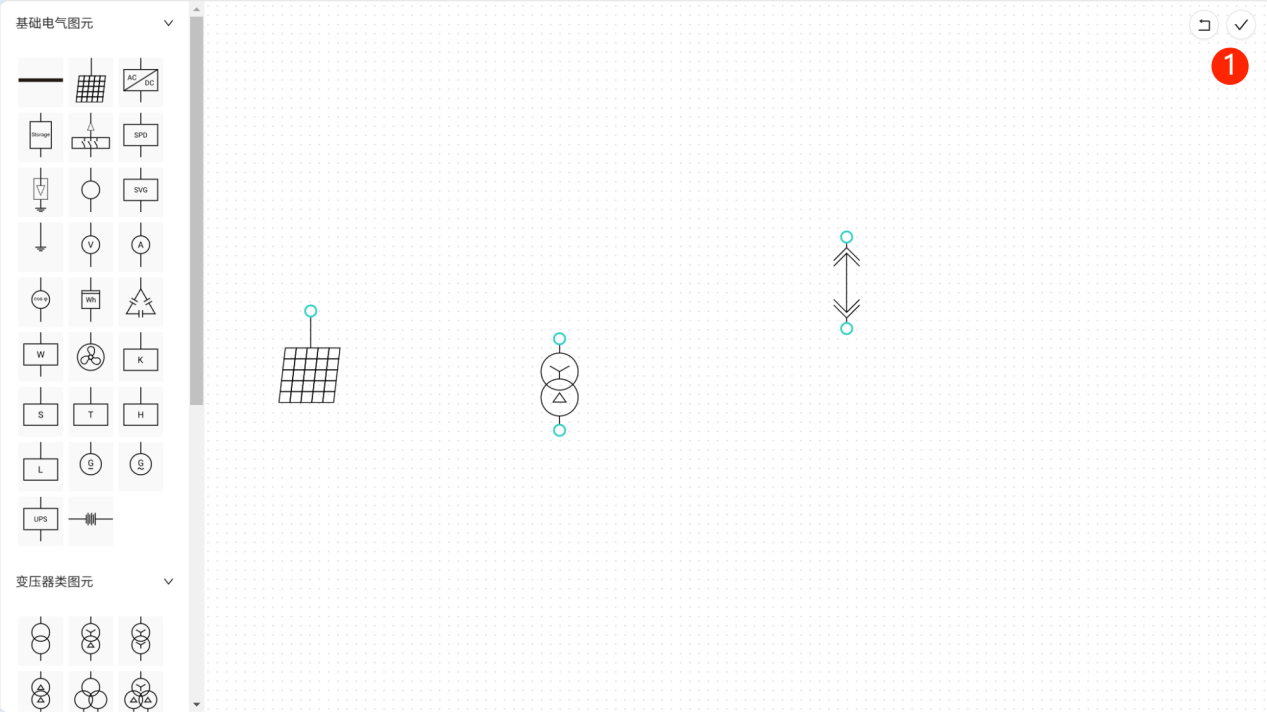
If you need to view or edit the device topology, please click this link to jump to the dedicated interface. This page does not provide direct operation functions.
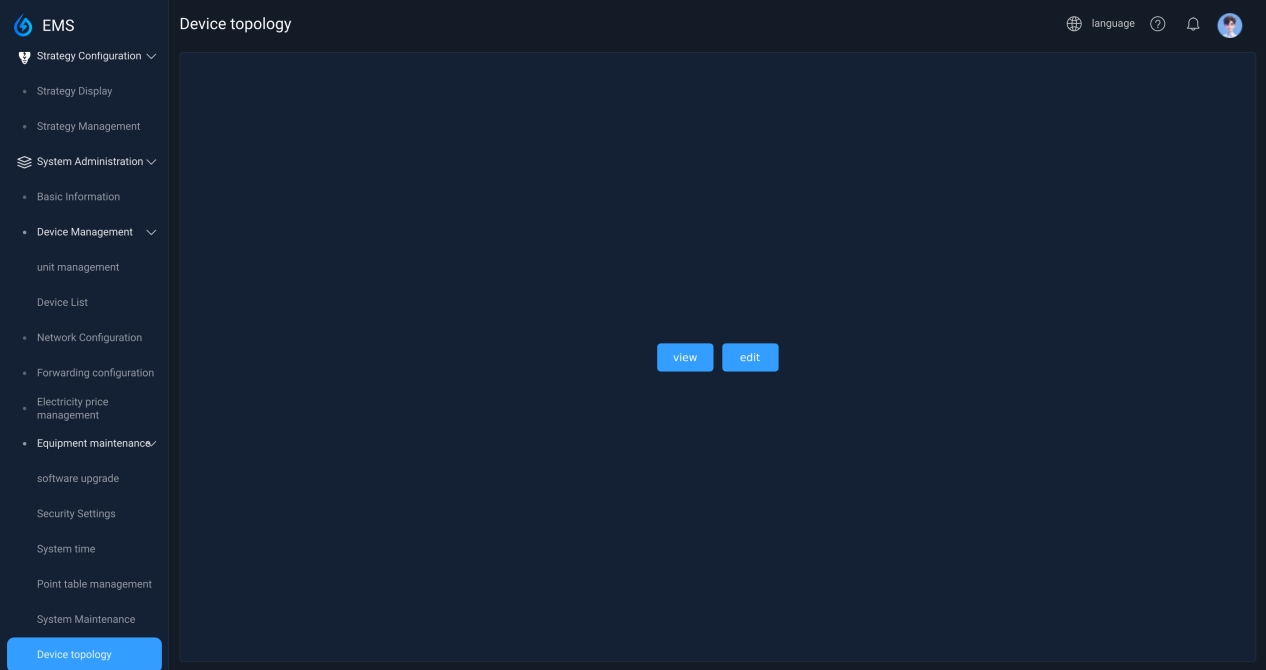
View and edit interface: Click the return and confirmation buttons in ① to return to the browsing interface. The browsing interface does not have the various components on the left, and cannot be operated or edited. It can only be viewed.
 -->
-->