System Monitoring & Real-Time Overview
1. Overview
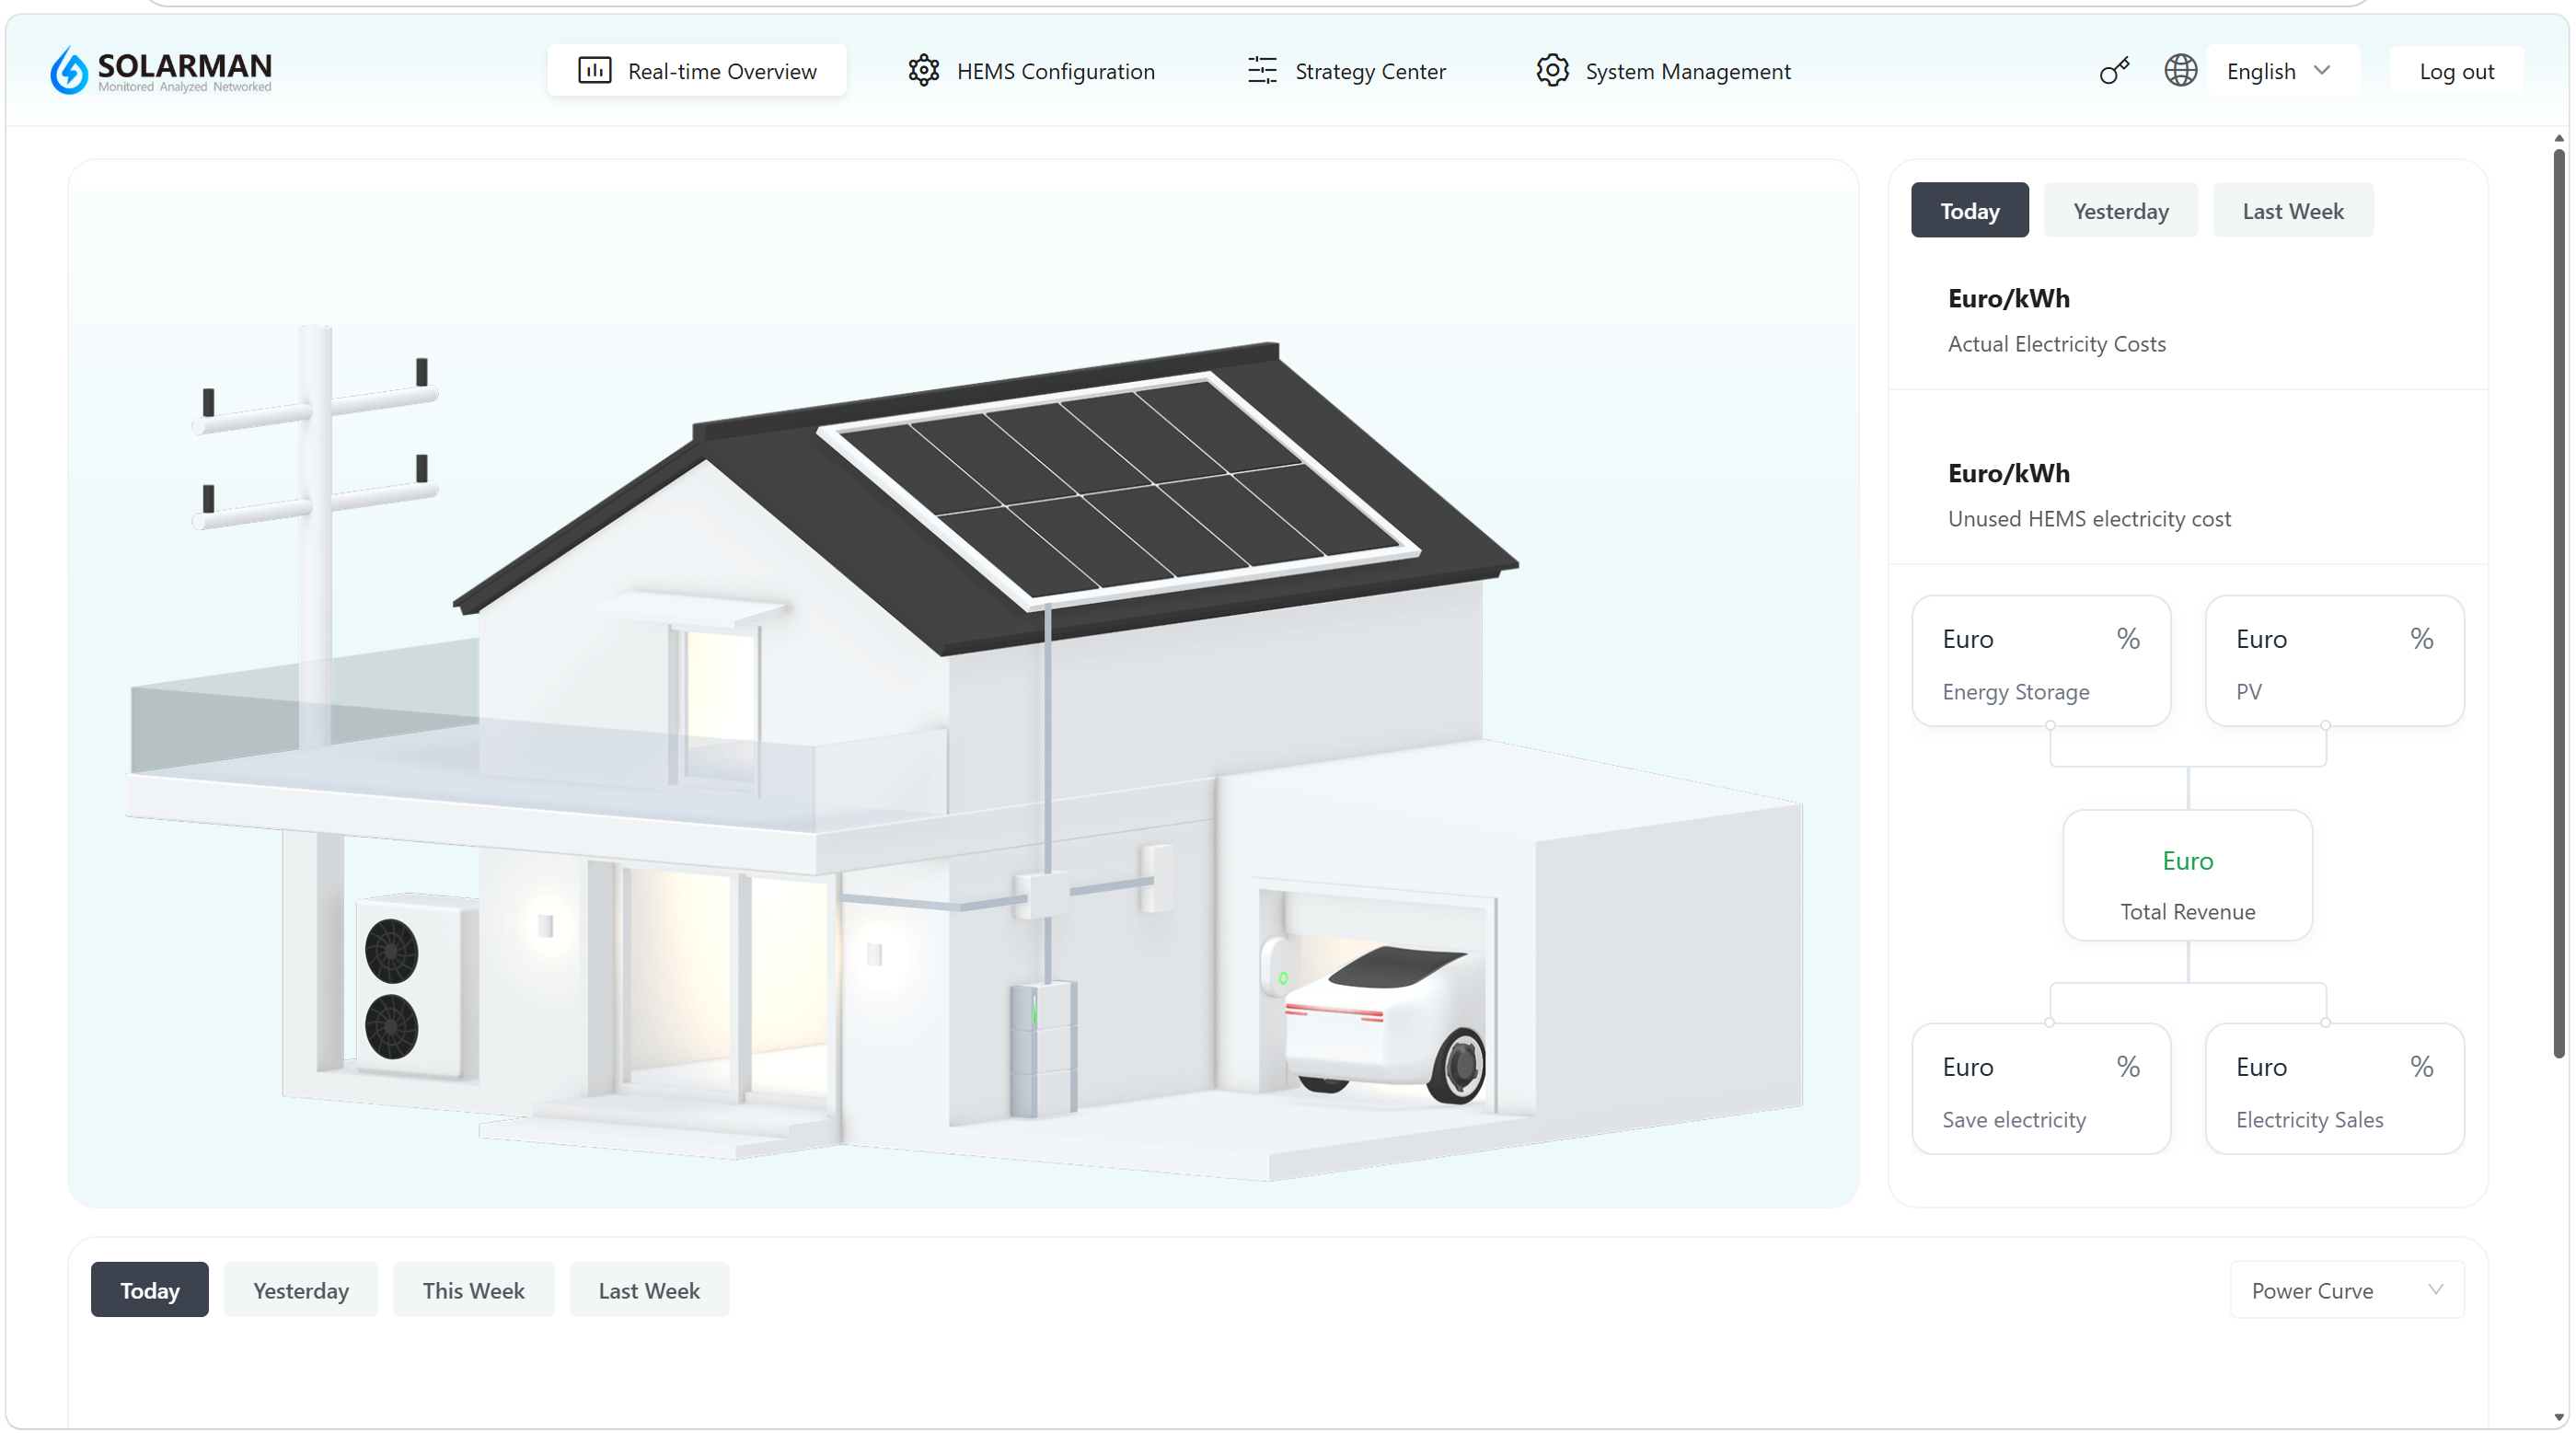
The system home page (Real-Time Overview) provides a complete view of the home energy system’s operating status, including key components such as photovoltaic (PV) generation, energy storage, grid interaction, and household loads. It also provides visualized energy flow and economic performance information.
Through this page, users can quickly understand the current operating status and energy utilization efficiency of the system.
2. Page Overview
The home page mainly consists of the following sections:
2.1 System Topology Display (Core Area)
The center of the page graphically displays the home energy system structure, including:
- PV generation system
- Energy storage system (battery)
- Household loads
- Grid connection
- Electric vehicle (if available)
2.2 Time Range Selection
Time range options are provided on the right side and bottom of the page:
- Today
- Yesterday
- This Week / Last Week
👉 Used to switch data display across different time periods.
2.3 Cost & Revenue Analysis
The right side displays energy economic data, including:
- Actual electricity cost
- Electricity cost without the HEMS system (comparison reference)
- Total revenue
The following items are also displayed in a structured format:
- Energy storage revenue
- PV revenue
- Electricity savings
- Feed-in revenue
👉 Helps users evaluate the economic benefits of the system.
2.4 Energy Breakdown Display
Different energy sources and usage categories are displayed in modular sections:
- PV generation contribution
- Energy storage participation
- Grid interaction (power purchase / feed-in)
👉 Supports display by amount or percentage.
2.5 Data Chart Area
The bottom section provides data trend charts (such as power curves):
- Supports switching between different chart types
- Displays system operating trends
👉 Used for analyzing load changes and energy usage patterns.
3. Instructions
- After entering the system home page, “Today” data is displayed by default.
- Use the time range buttons to view data from different periods.
- Observe the system topology diagram to understand the current energy flow.
- Check the revenue analysis section on the right to evaluate economic performance.
- Use the bottom charts to analyze system operating trends.
- Page data depends on proper device connection and communication status.
- If data is abnormal or not displayed, check device connections and network status.
- Data under different time ranges may have delayed updates.
Through the Real-Time Overview page, users can comprehensively monitor the operating status of the energy system and use the information as a basis for strategy optimization and operational adjustments.